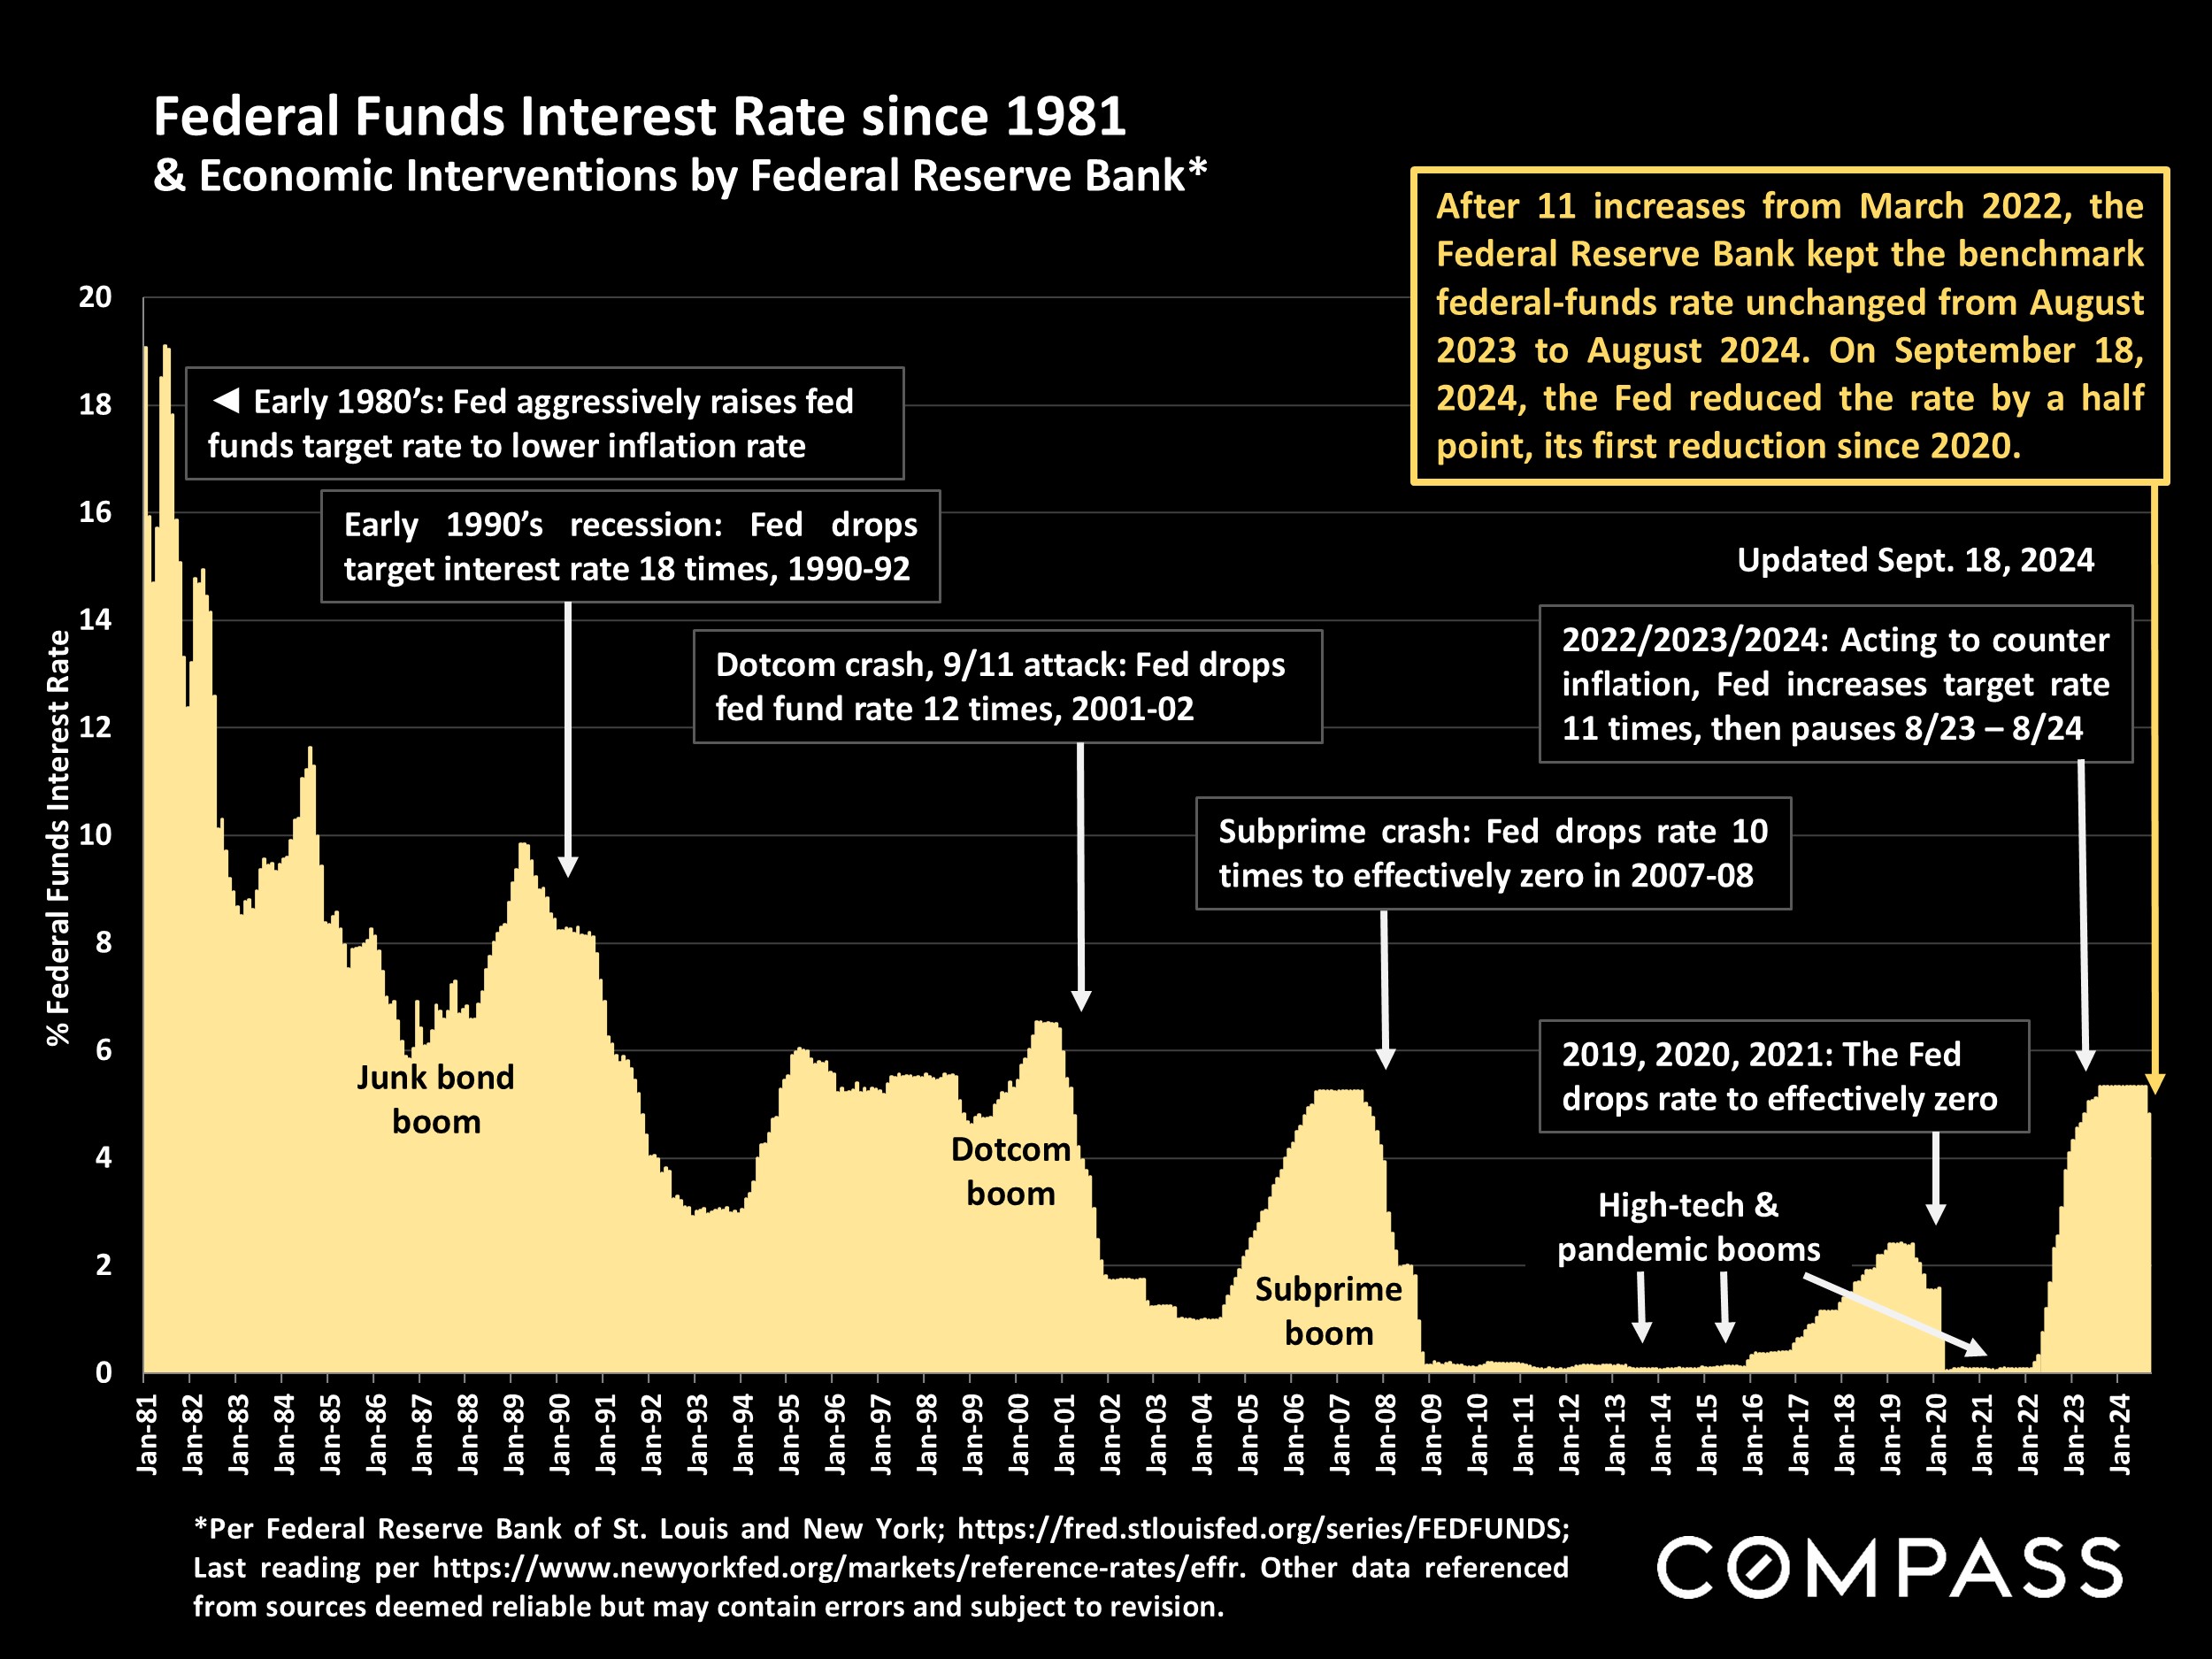
On September 18th, the Federal Reserve Bank dropped its benchmark rate for the first time since 2020 – a very positive development for housing markets – and many analysts expect one or more additional cuts before the end of the year. In their latest readings, inflation fell to its lowest point in 3½ years and consumer confidence improved for the 4th month running. Stock markets have been volatile since mid-July but remain close to all-time highs.
As of early October, mortgage rates were the lowest since February 2023, but then an unexpectedly strong jobs report caused them to spike back up, perhaps just a short-term fluctuation amid the major downward trend of recent months. It has been very challenging in recent years to predict changes in interest rates, as there are many unpredictable national & international economic and political factors at play, but the consensus opinion is that rates will (probably) continue to decline in Q4.
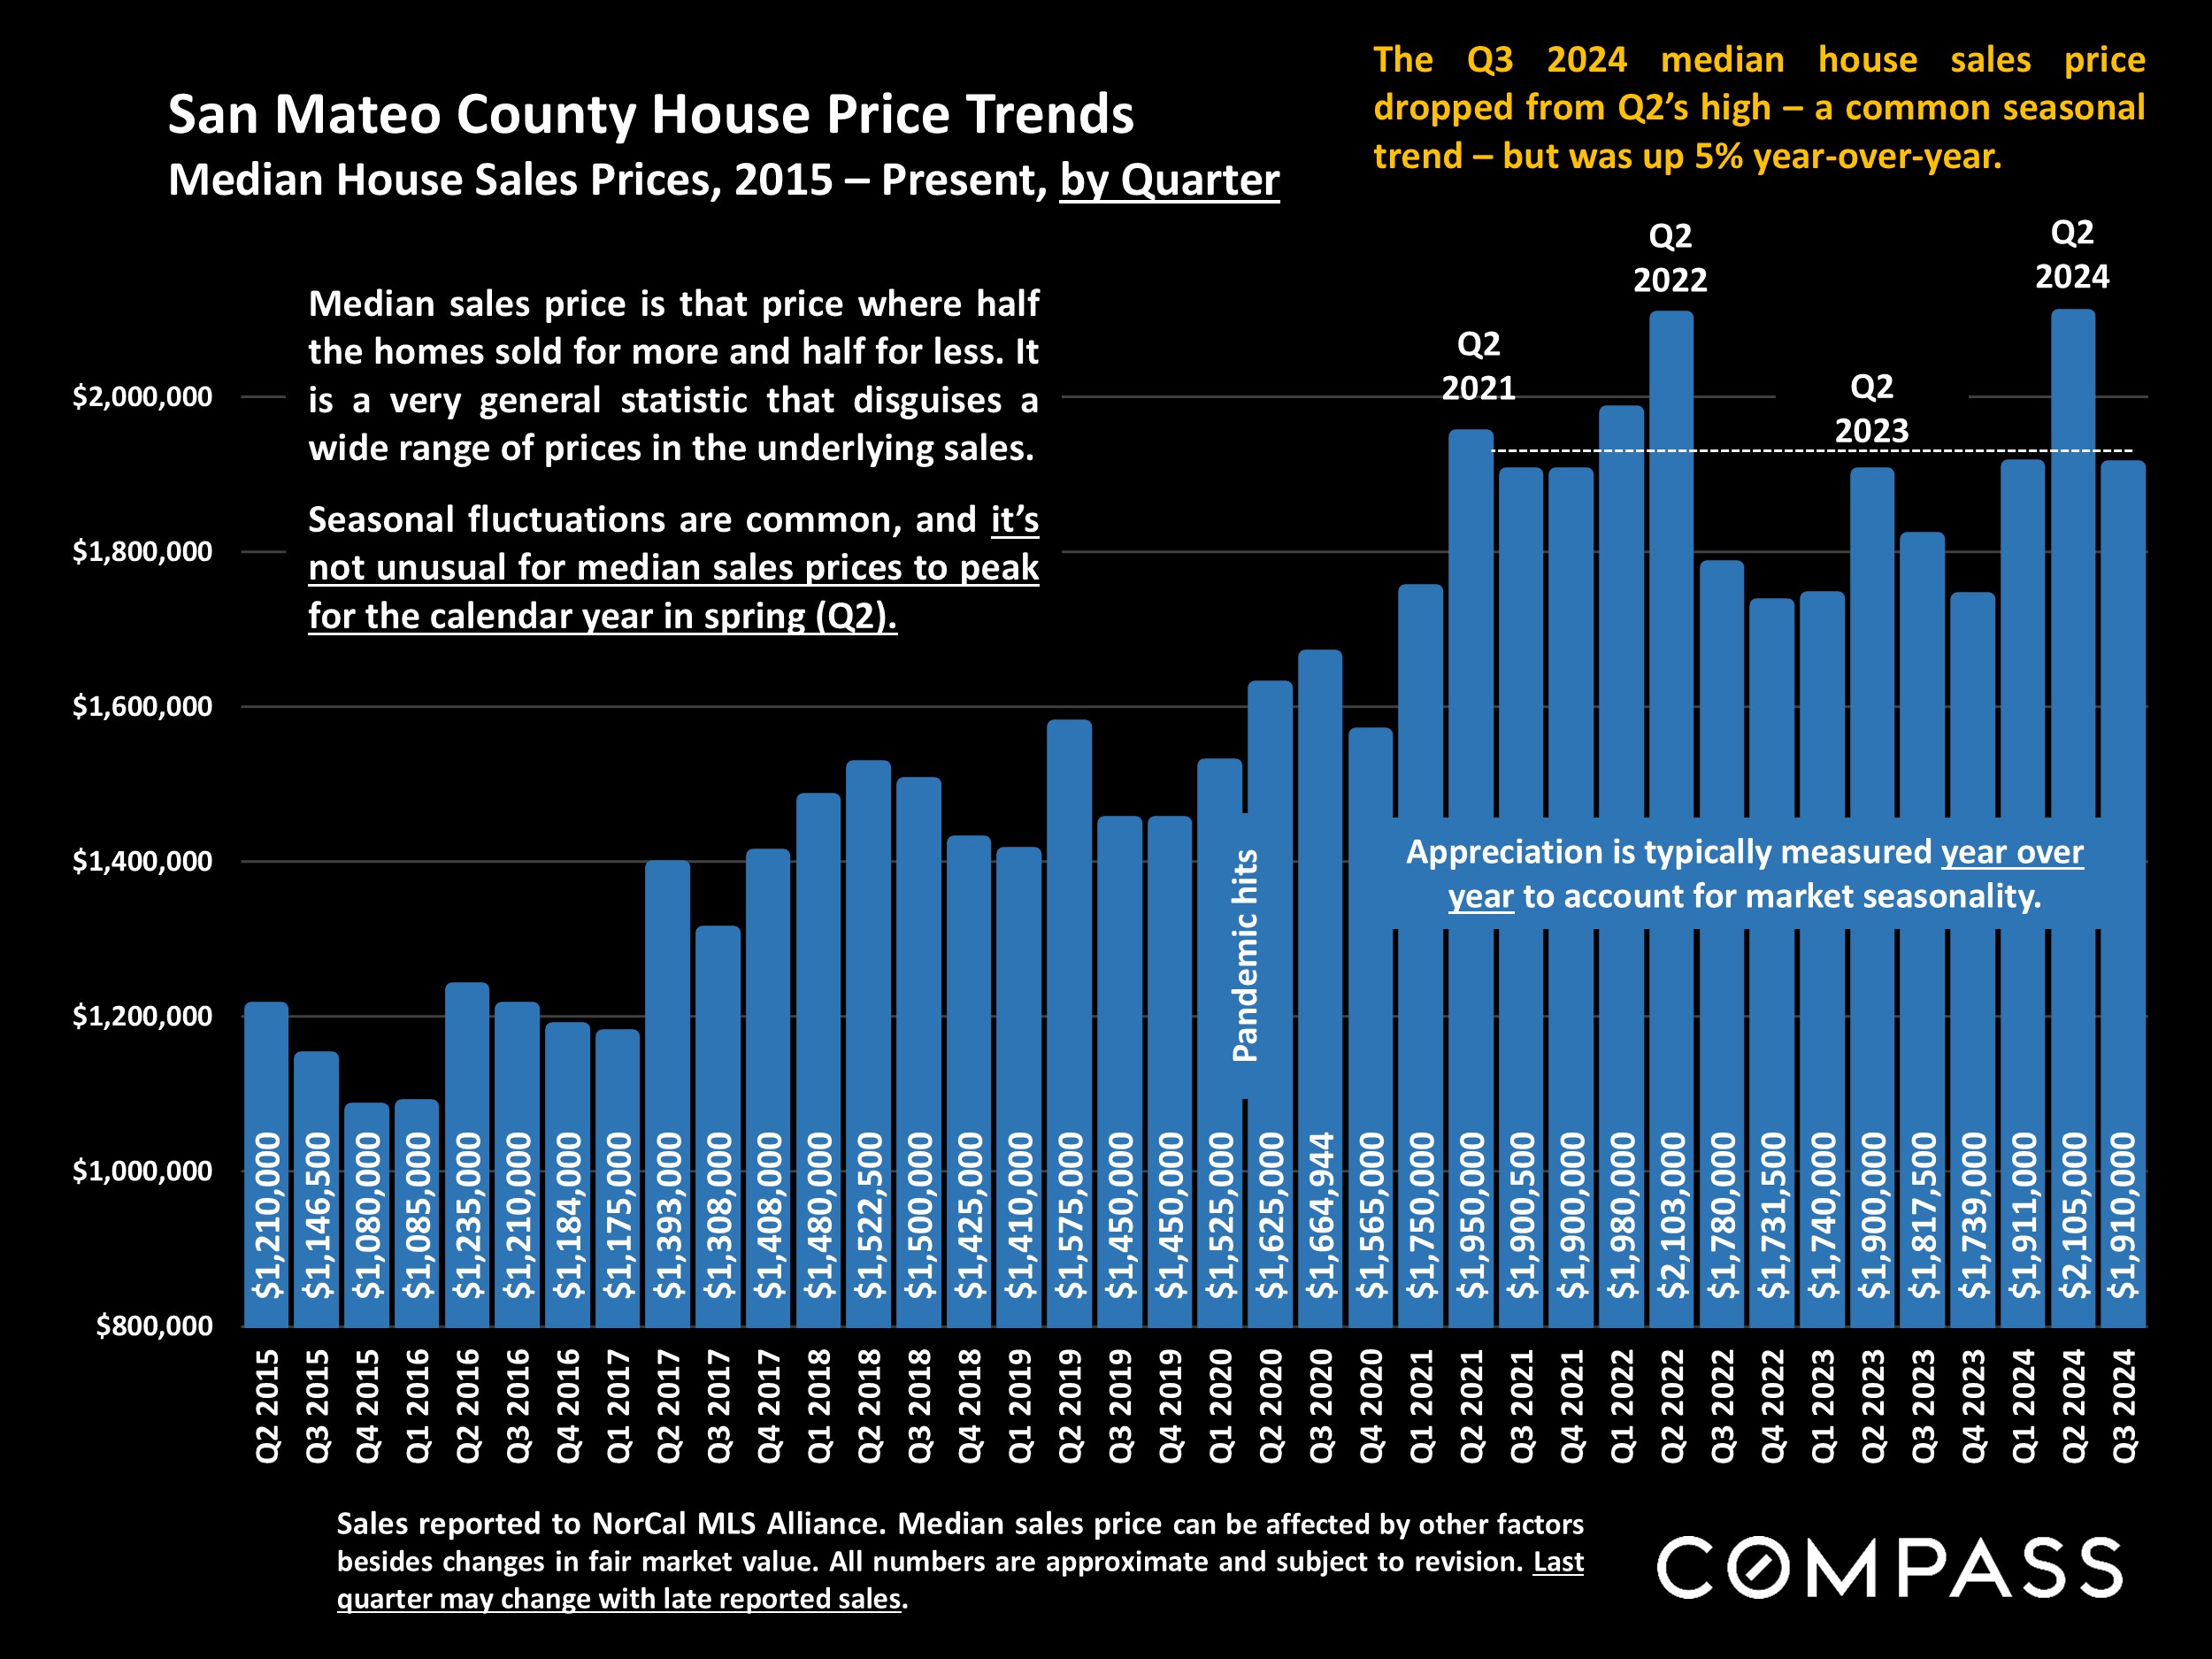
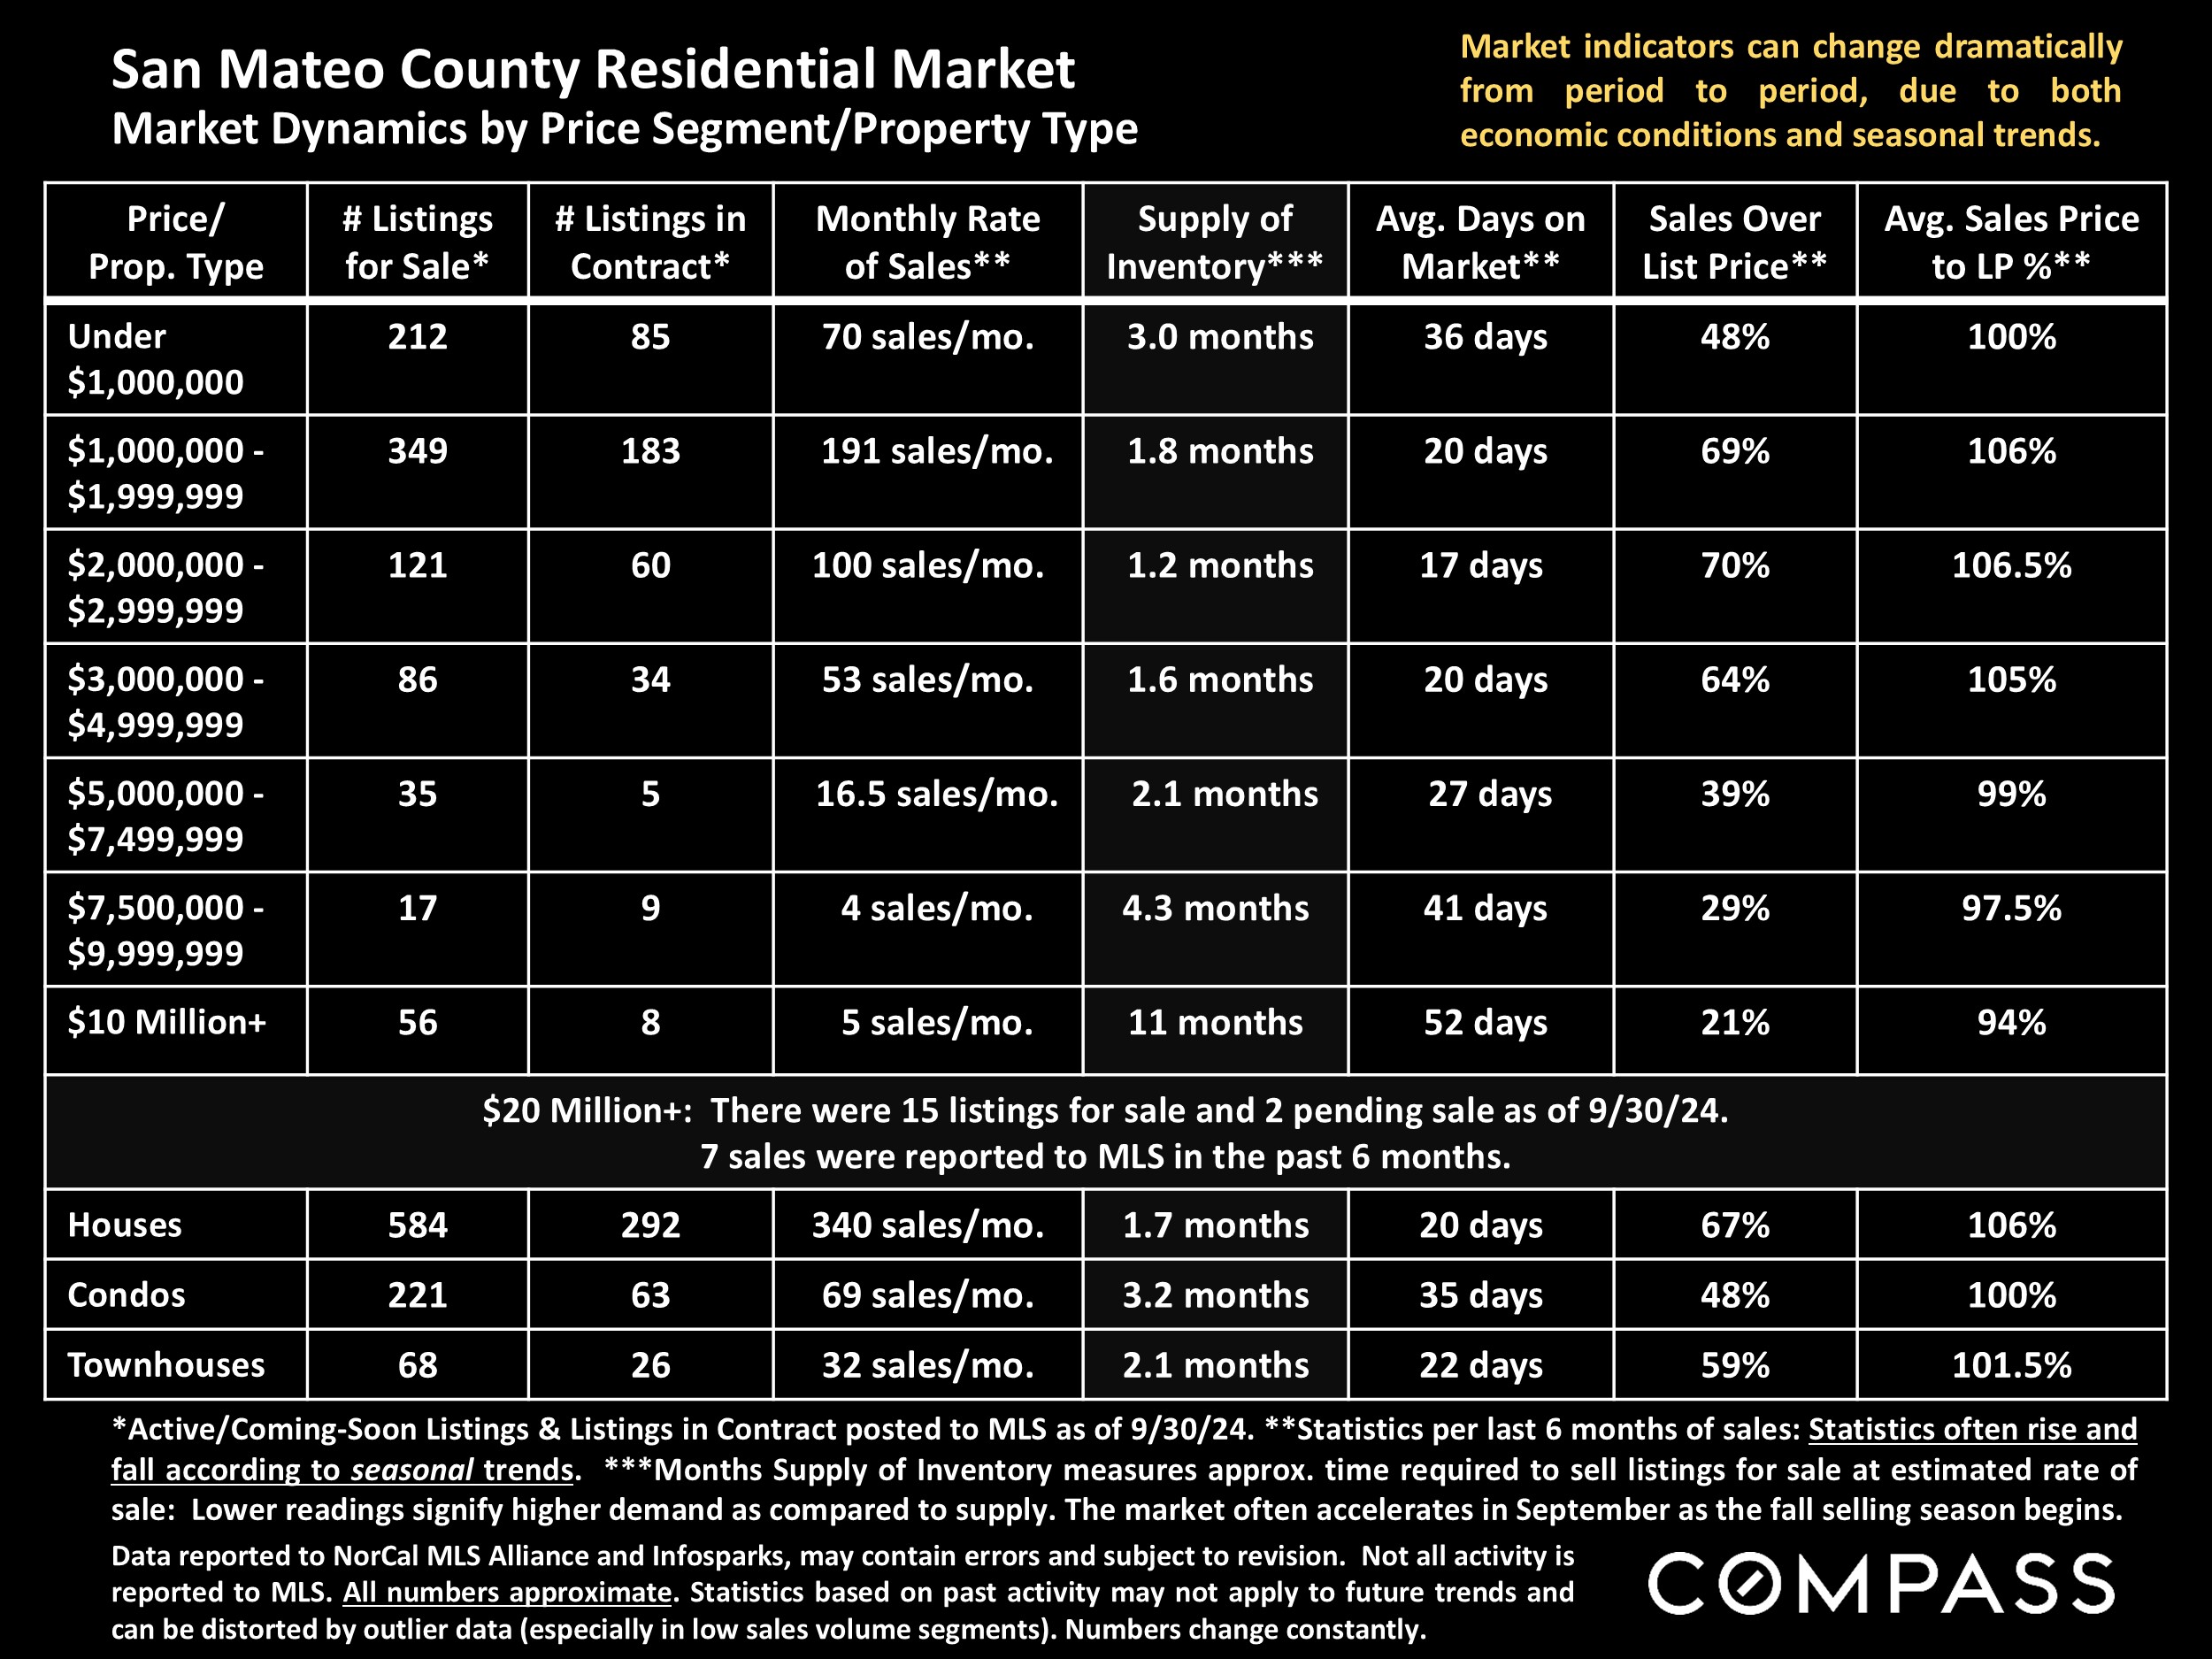
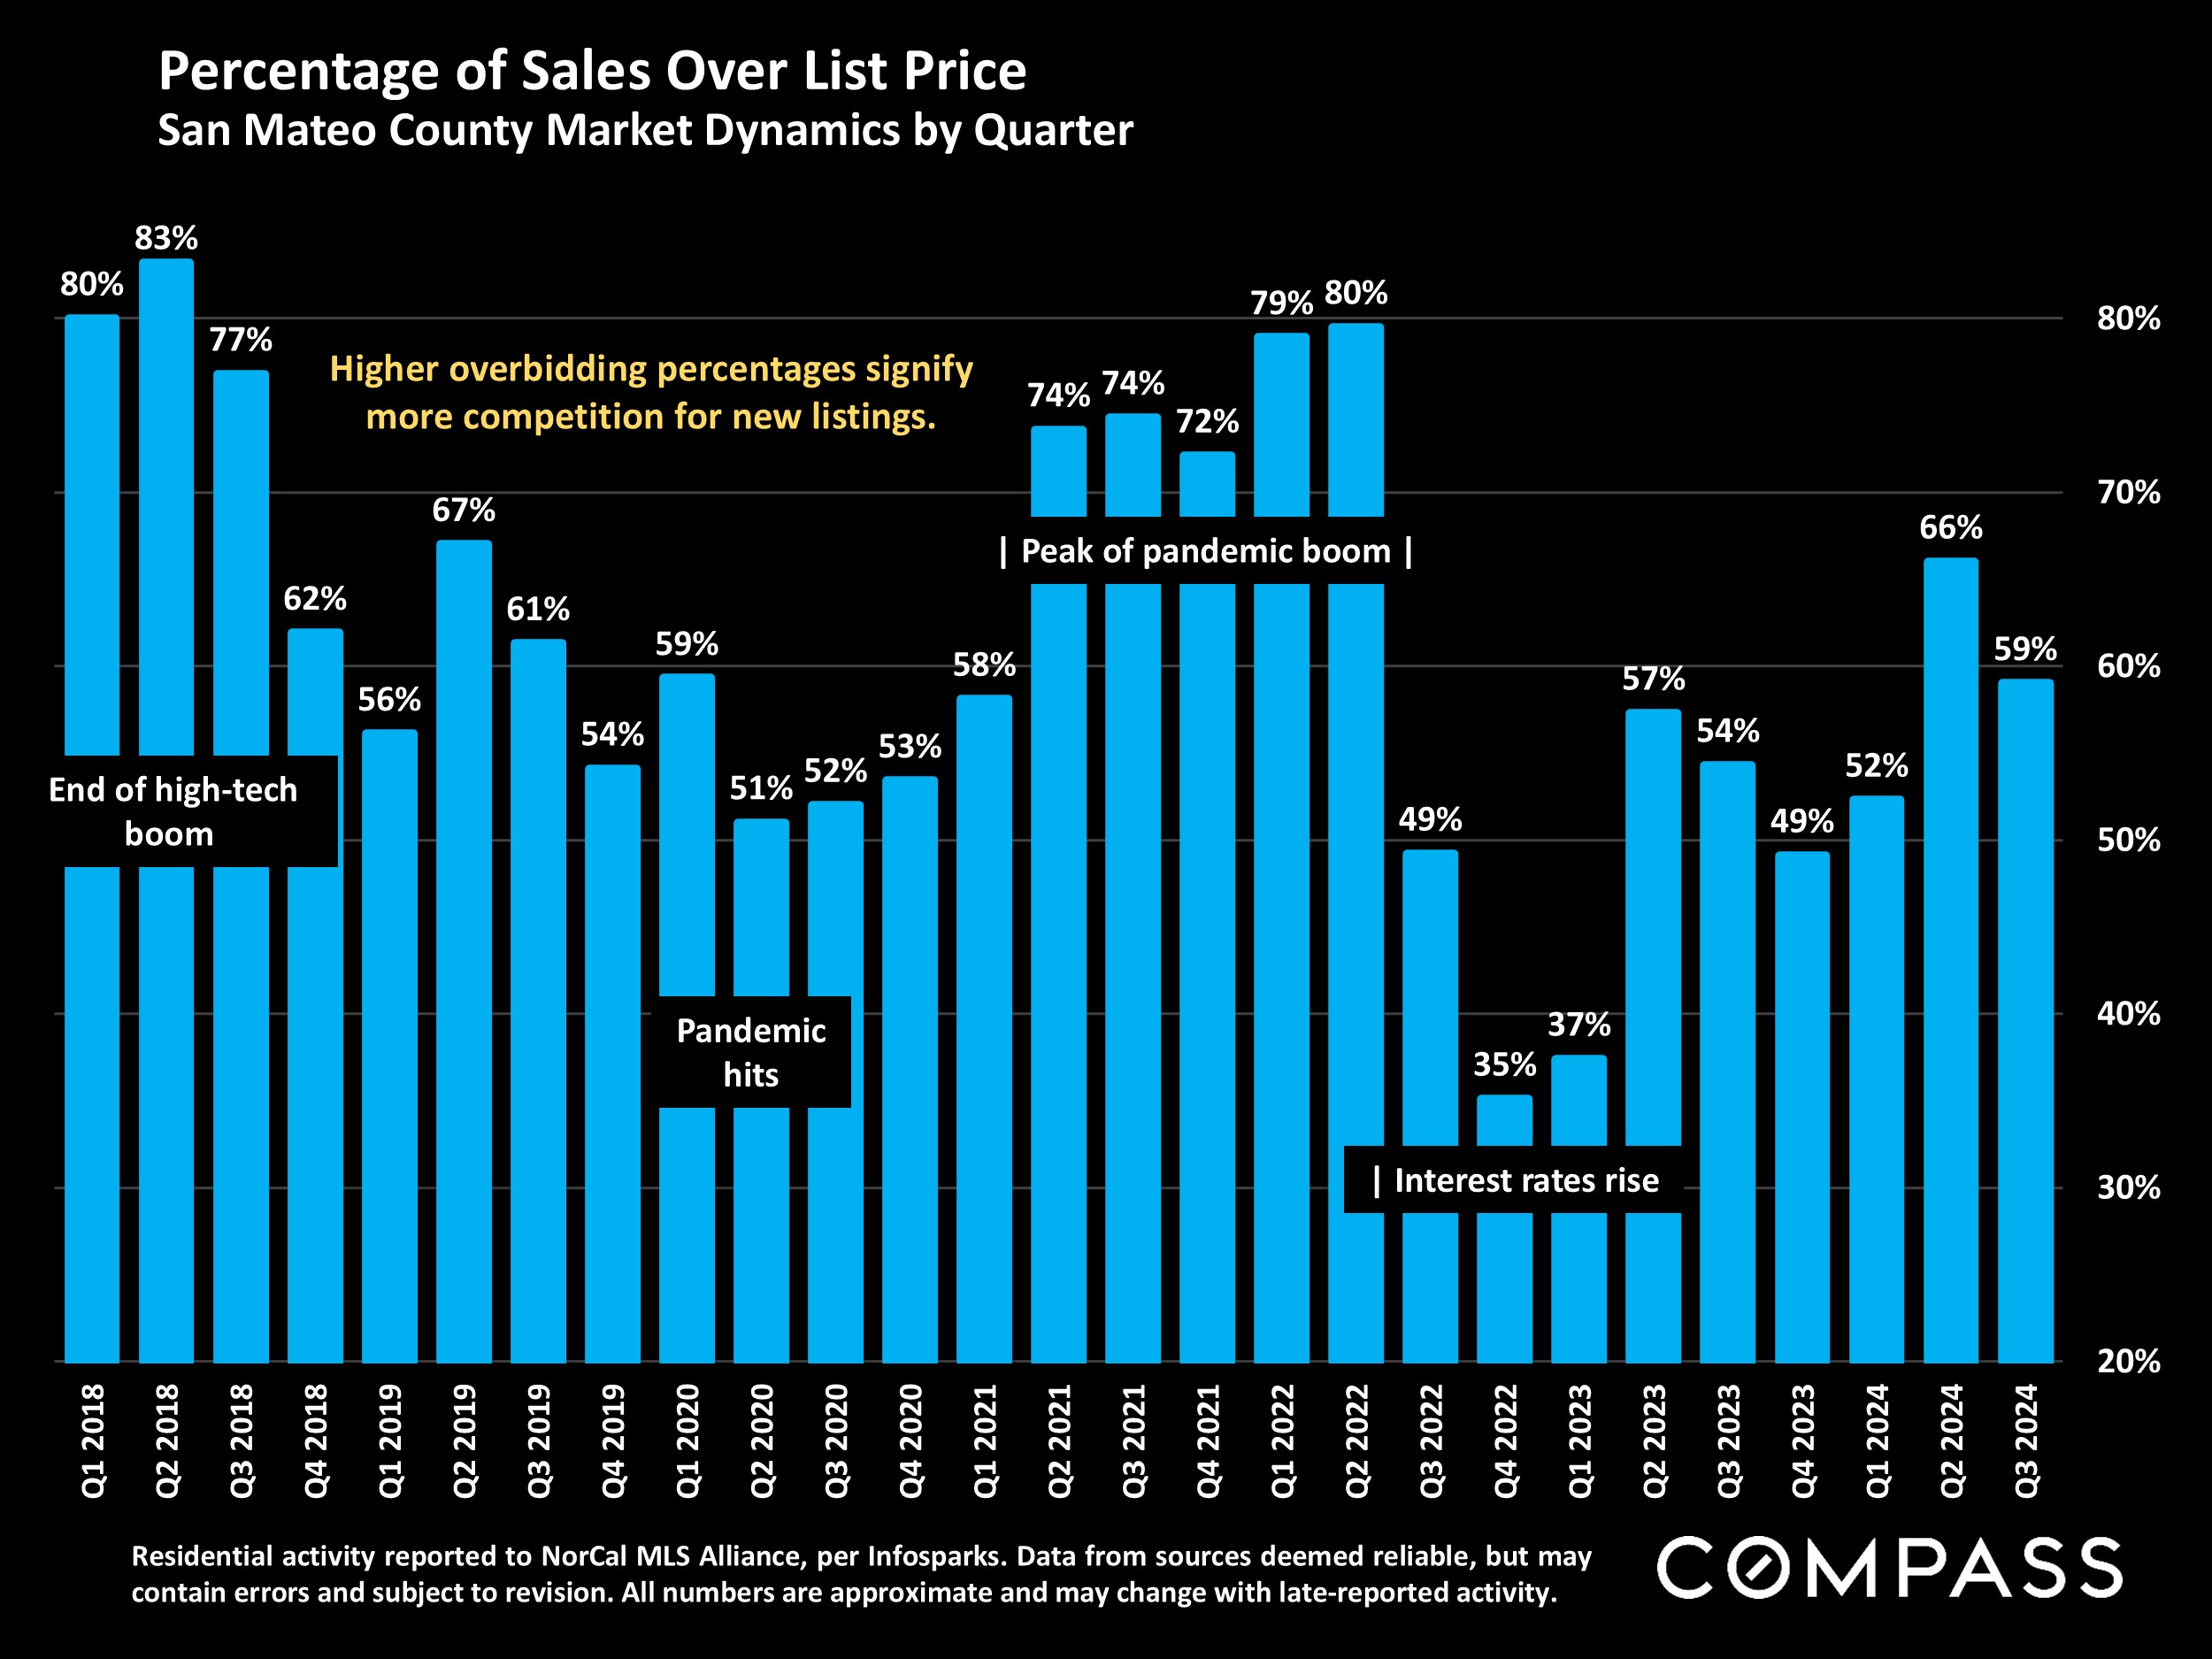
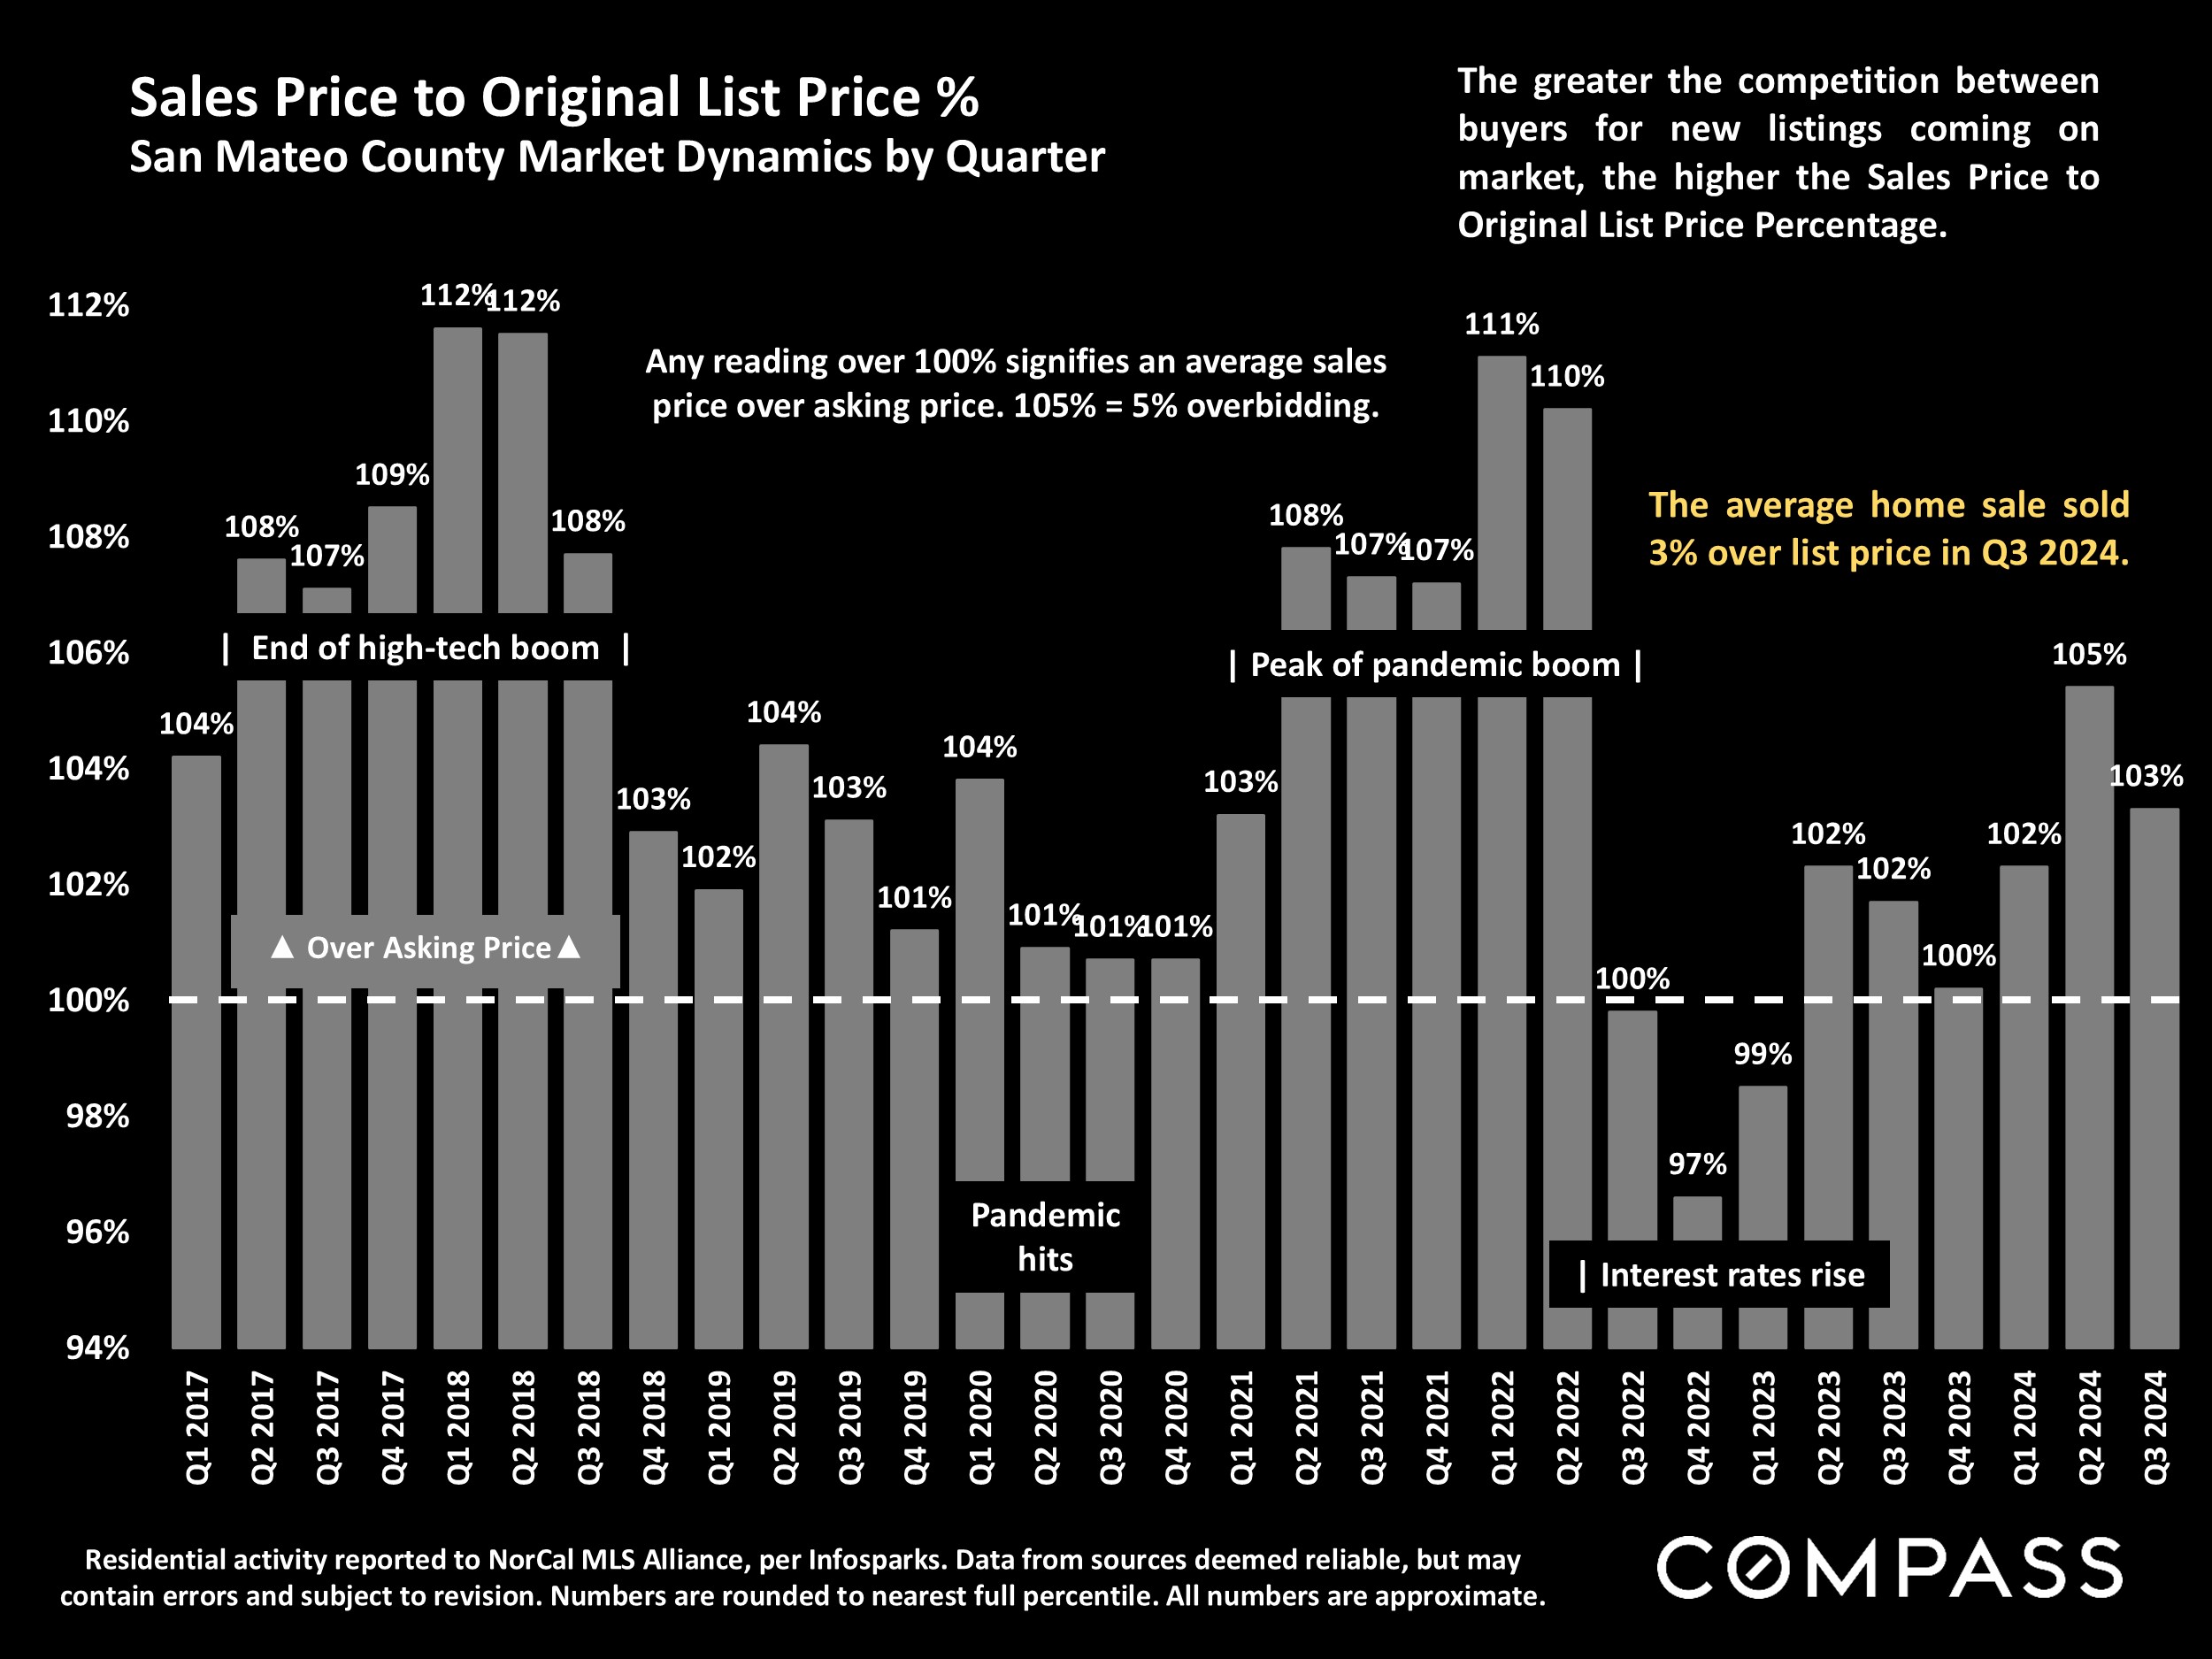
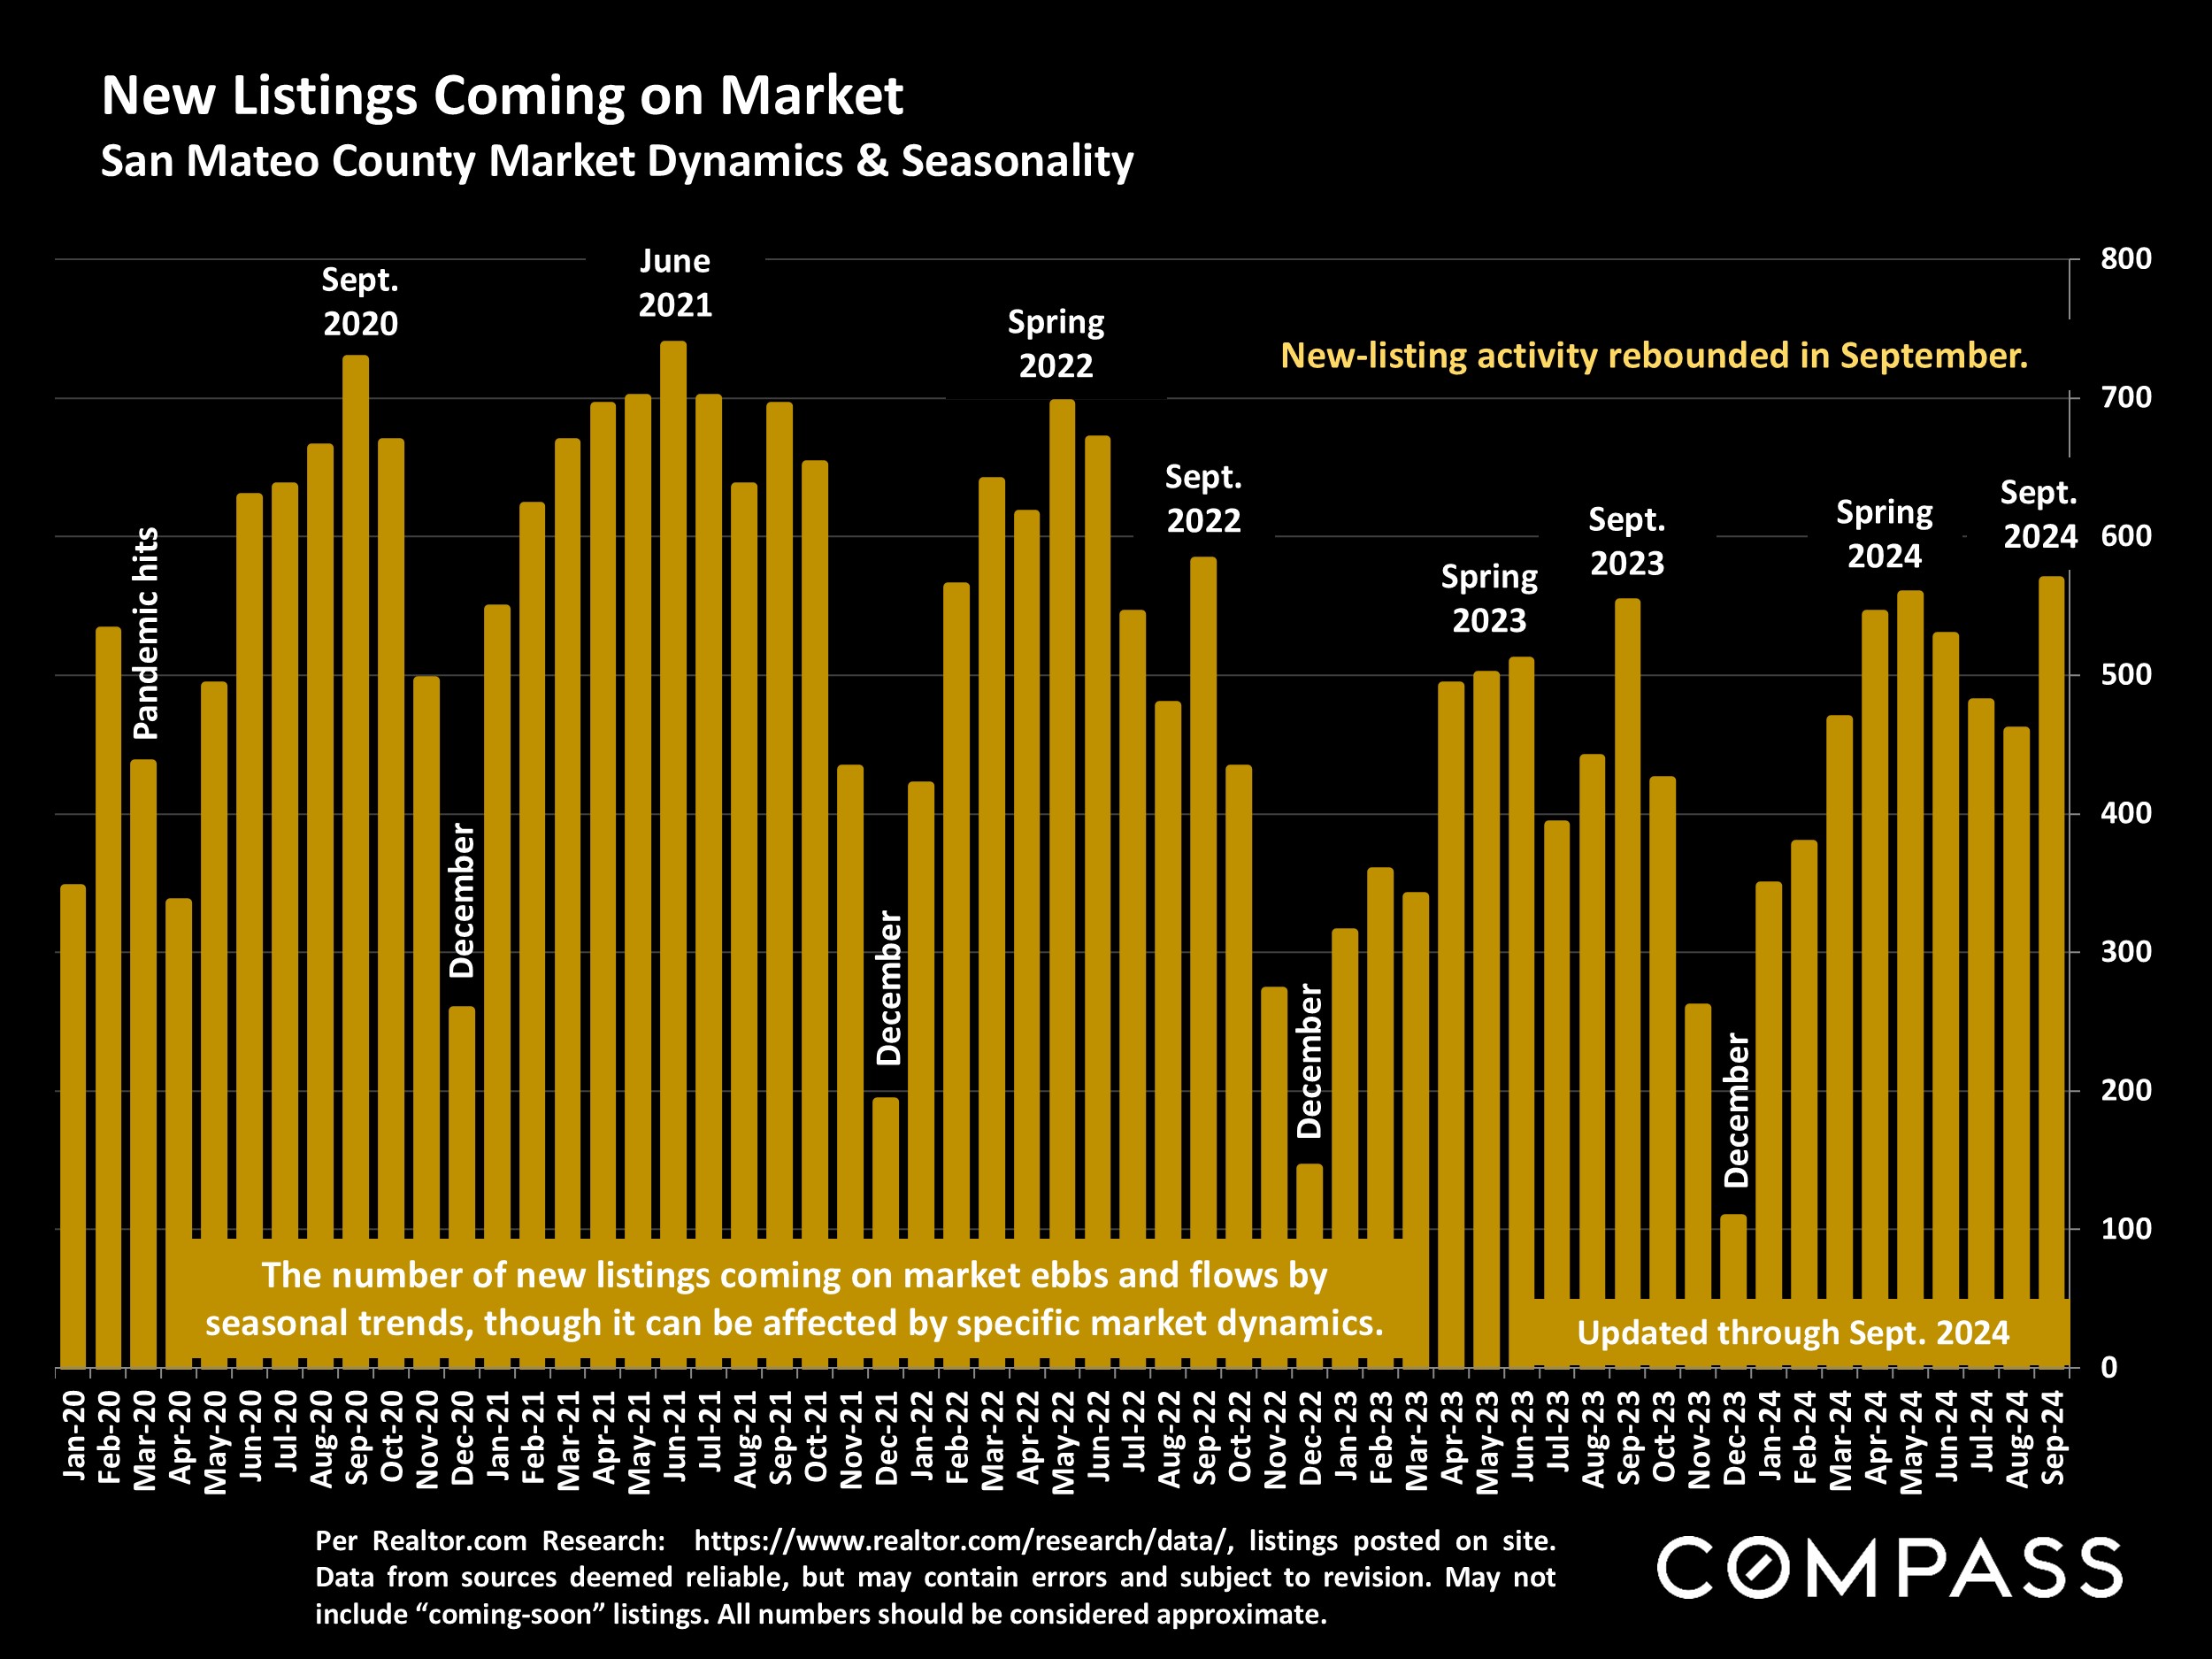
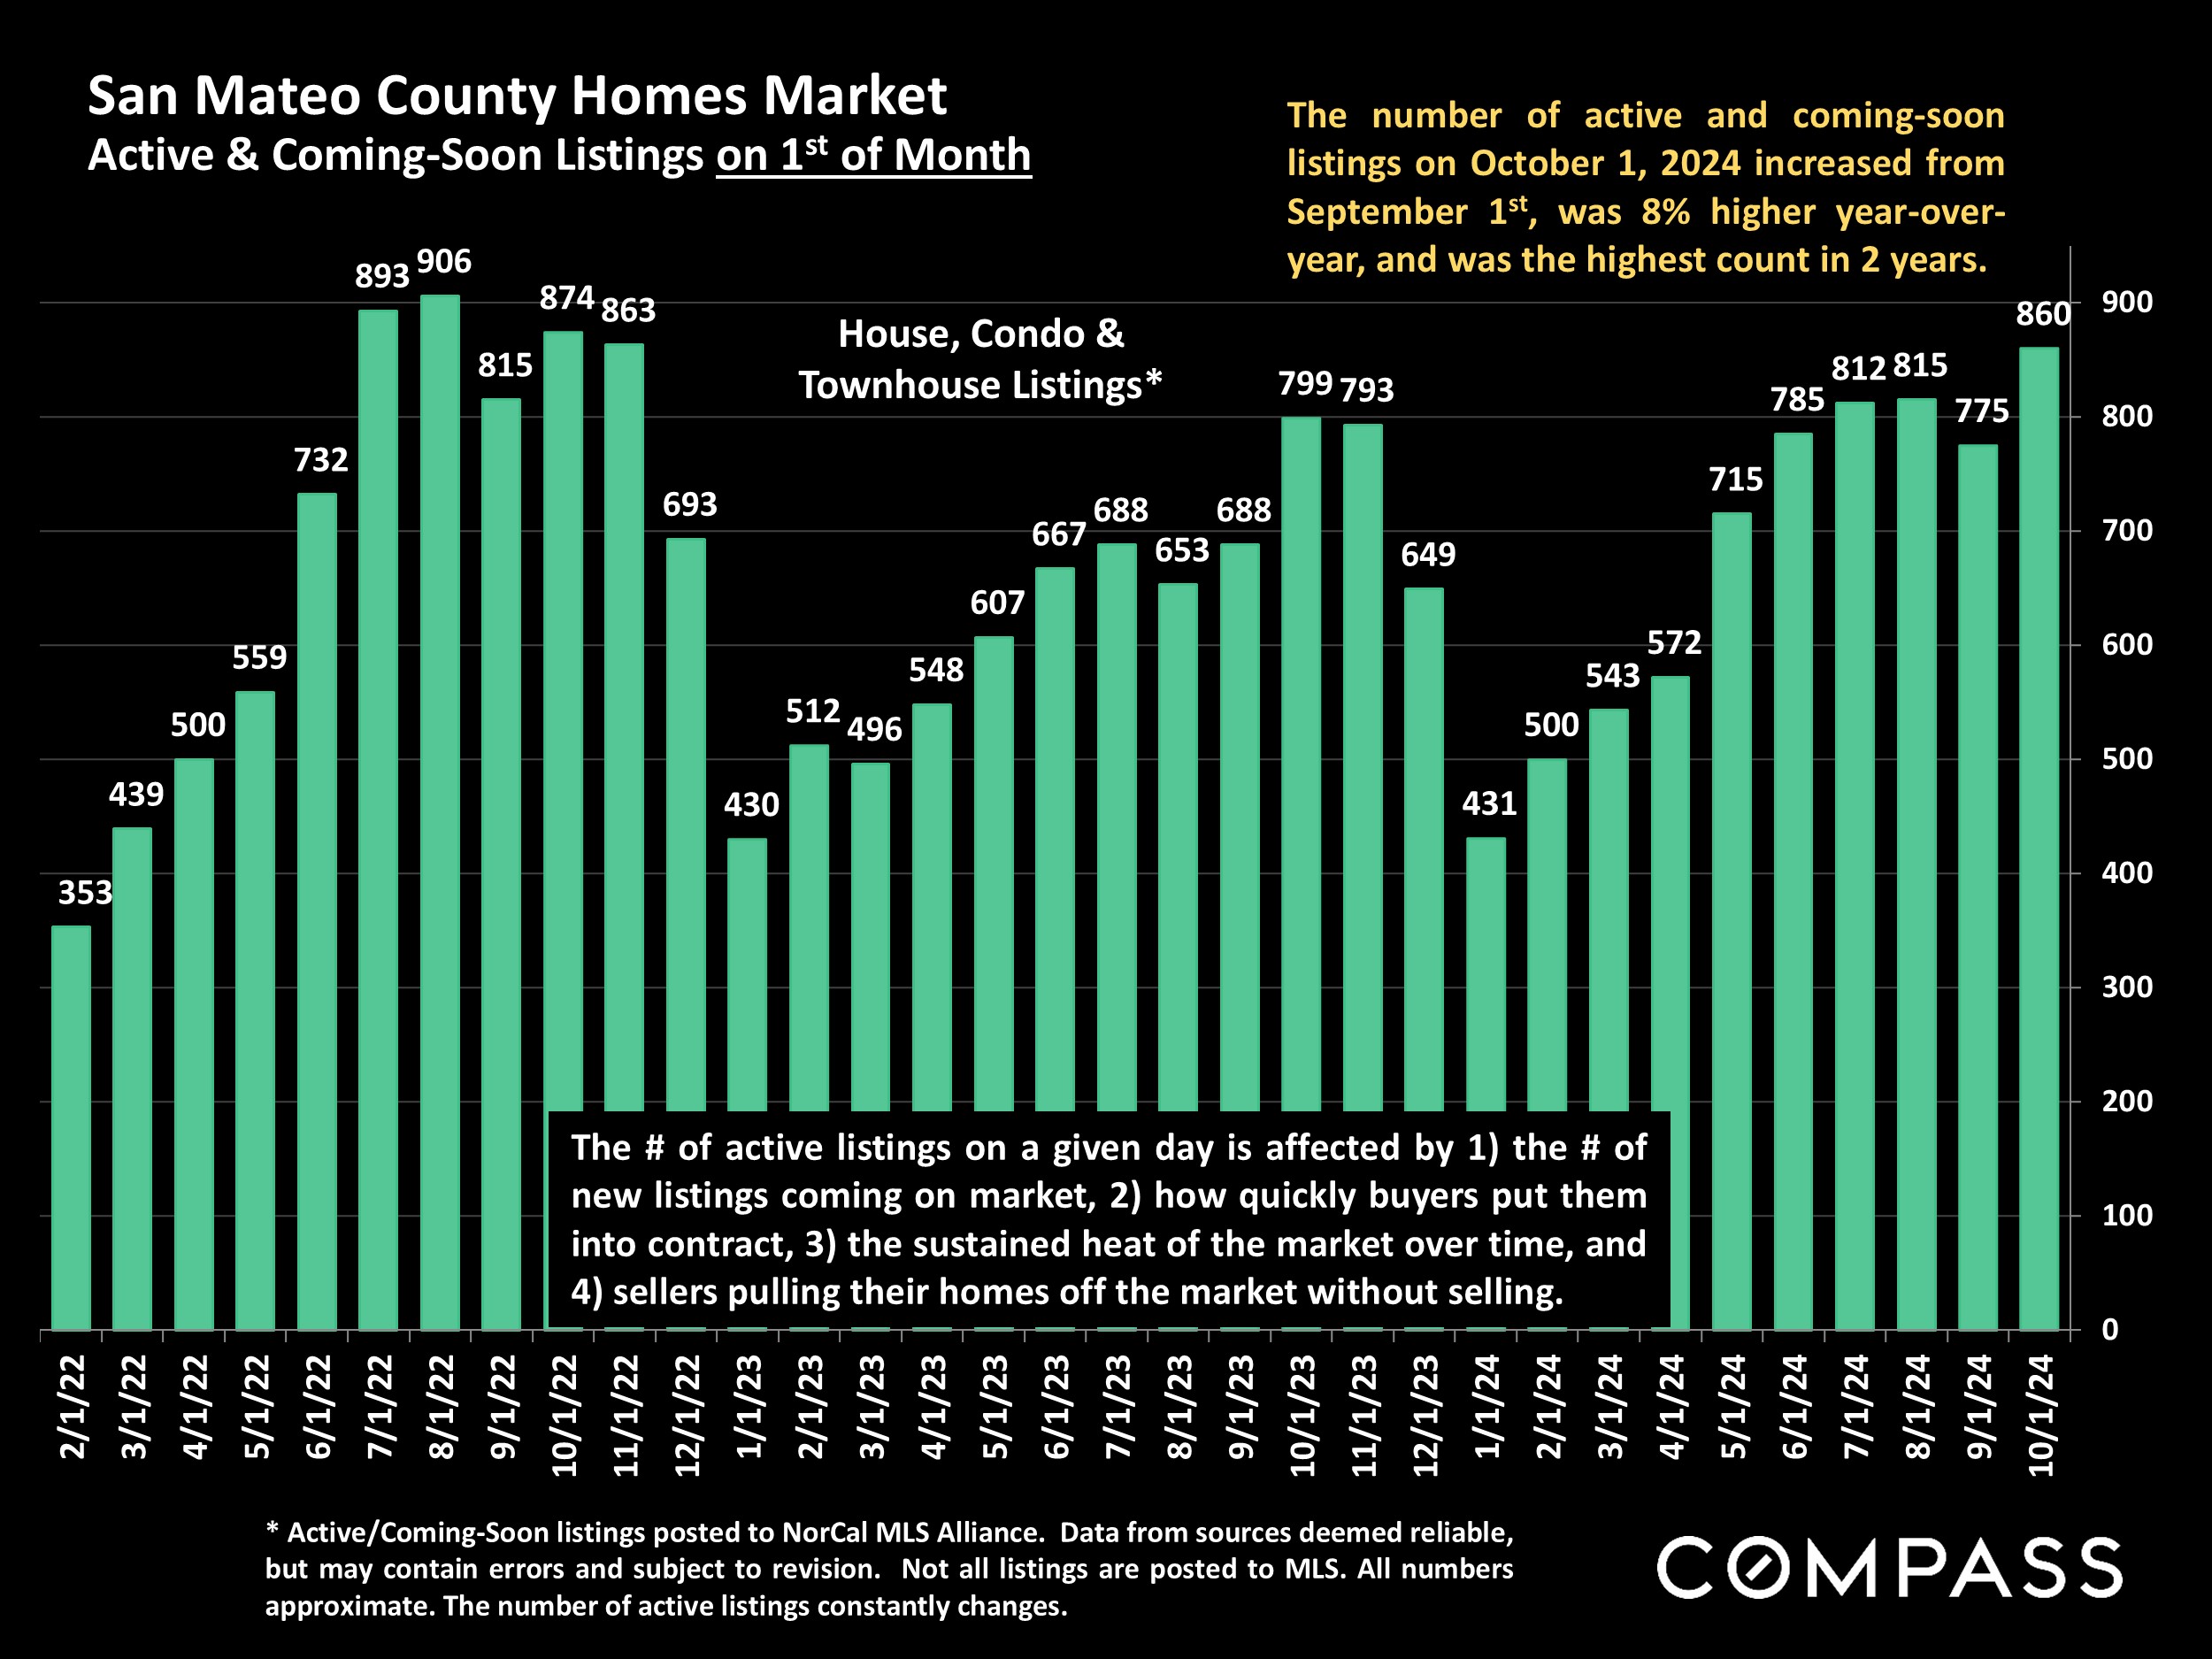
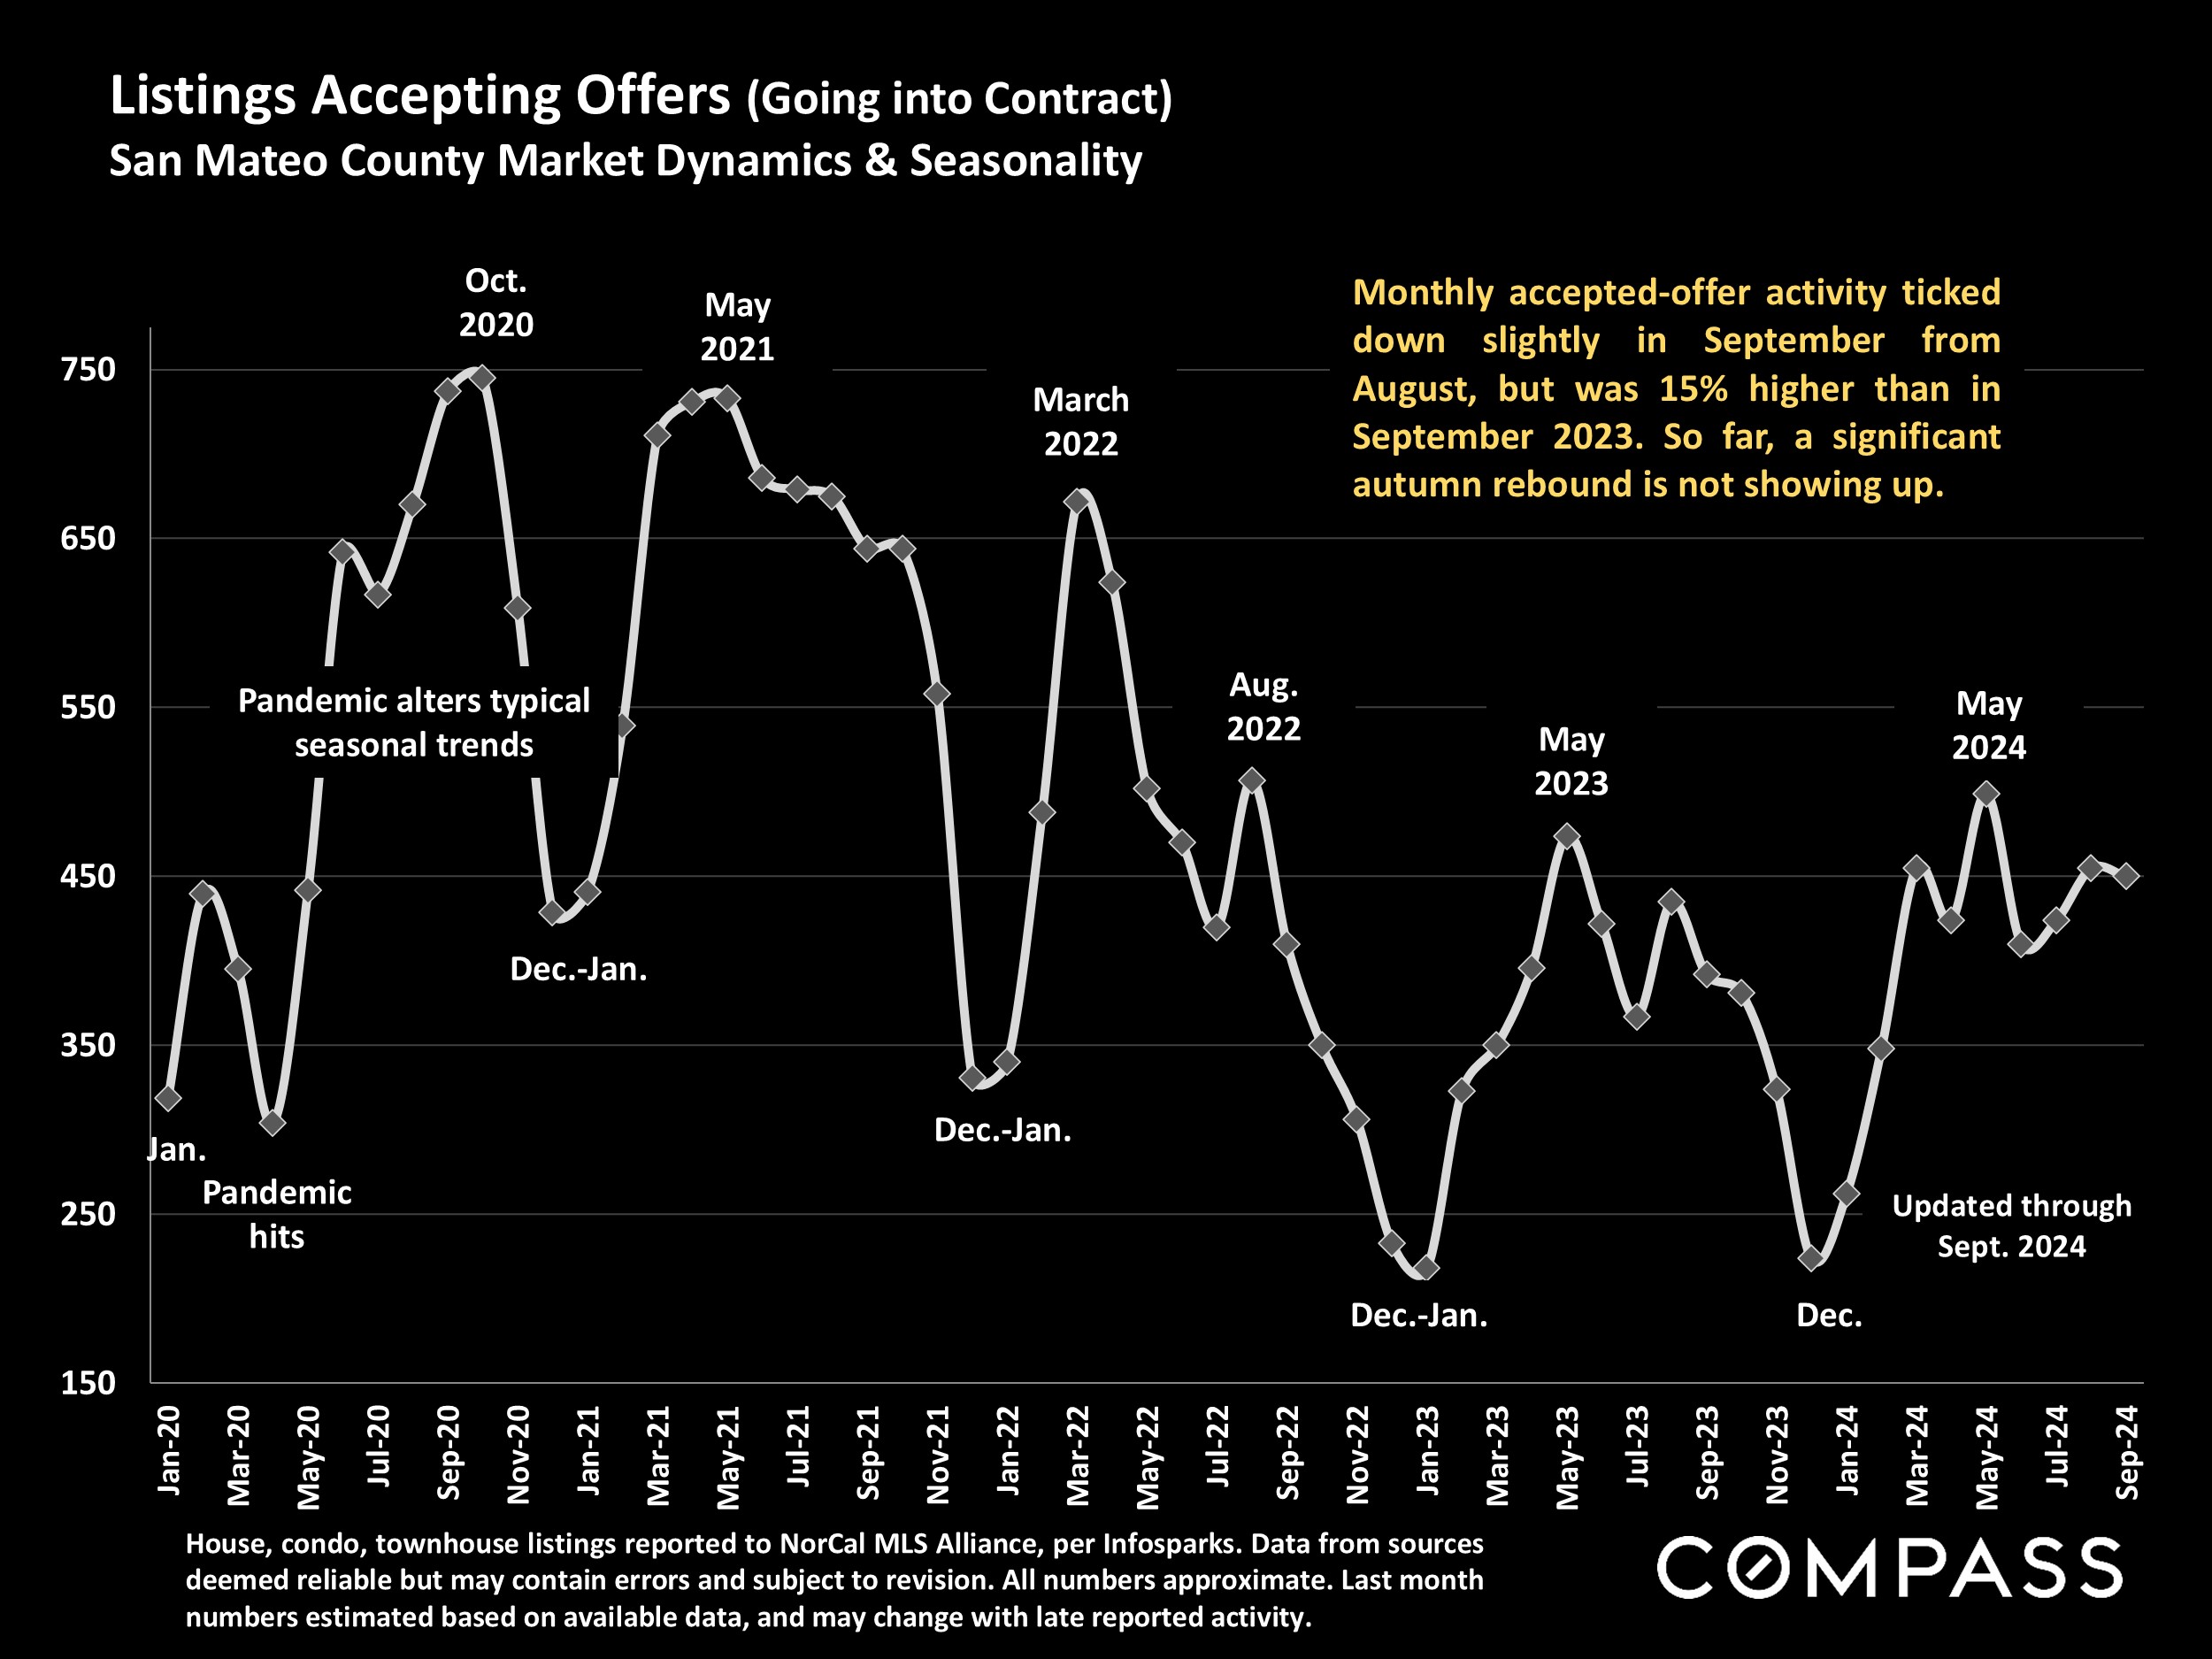
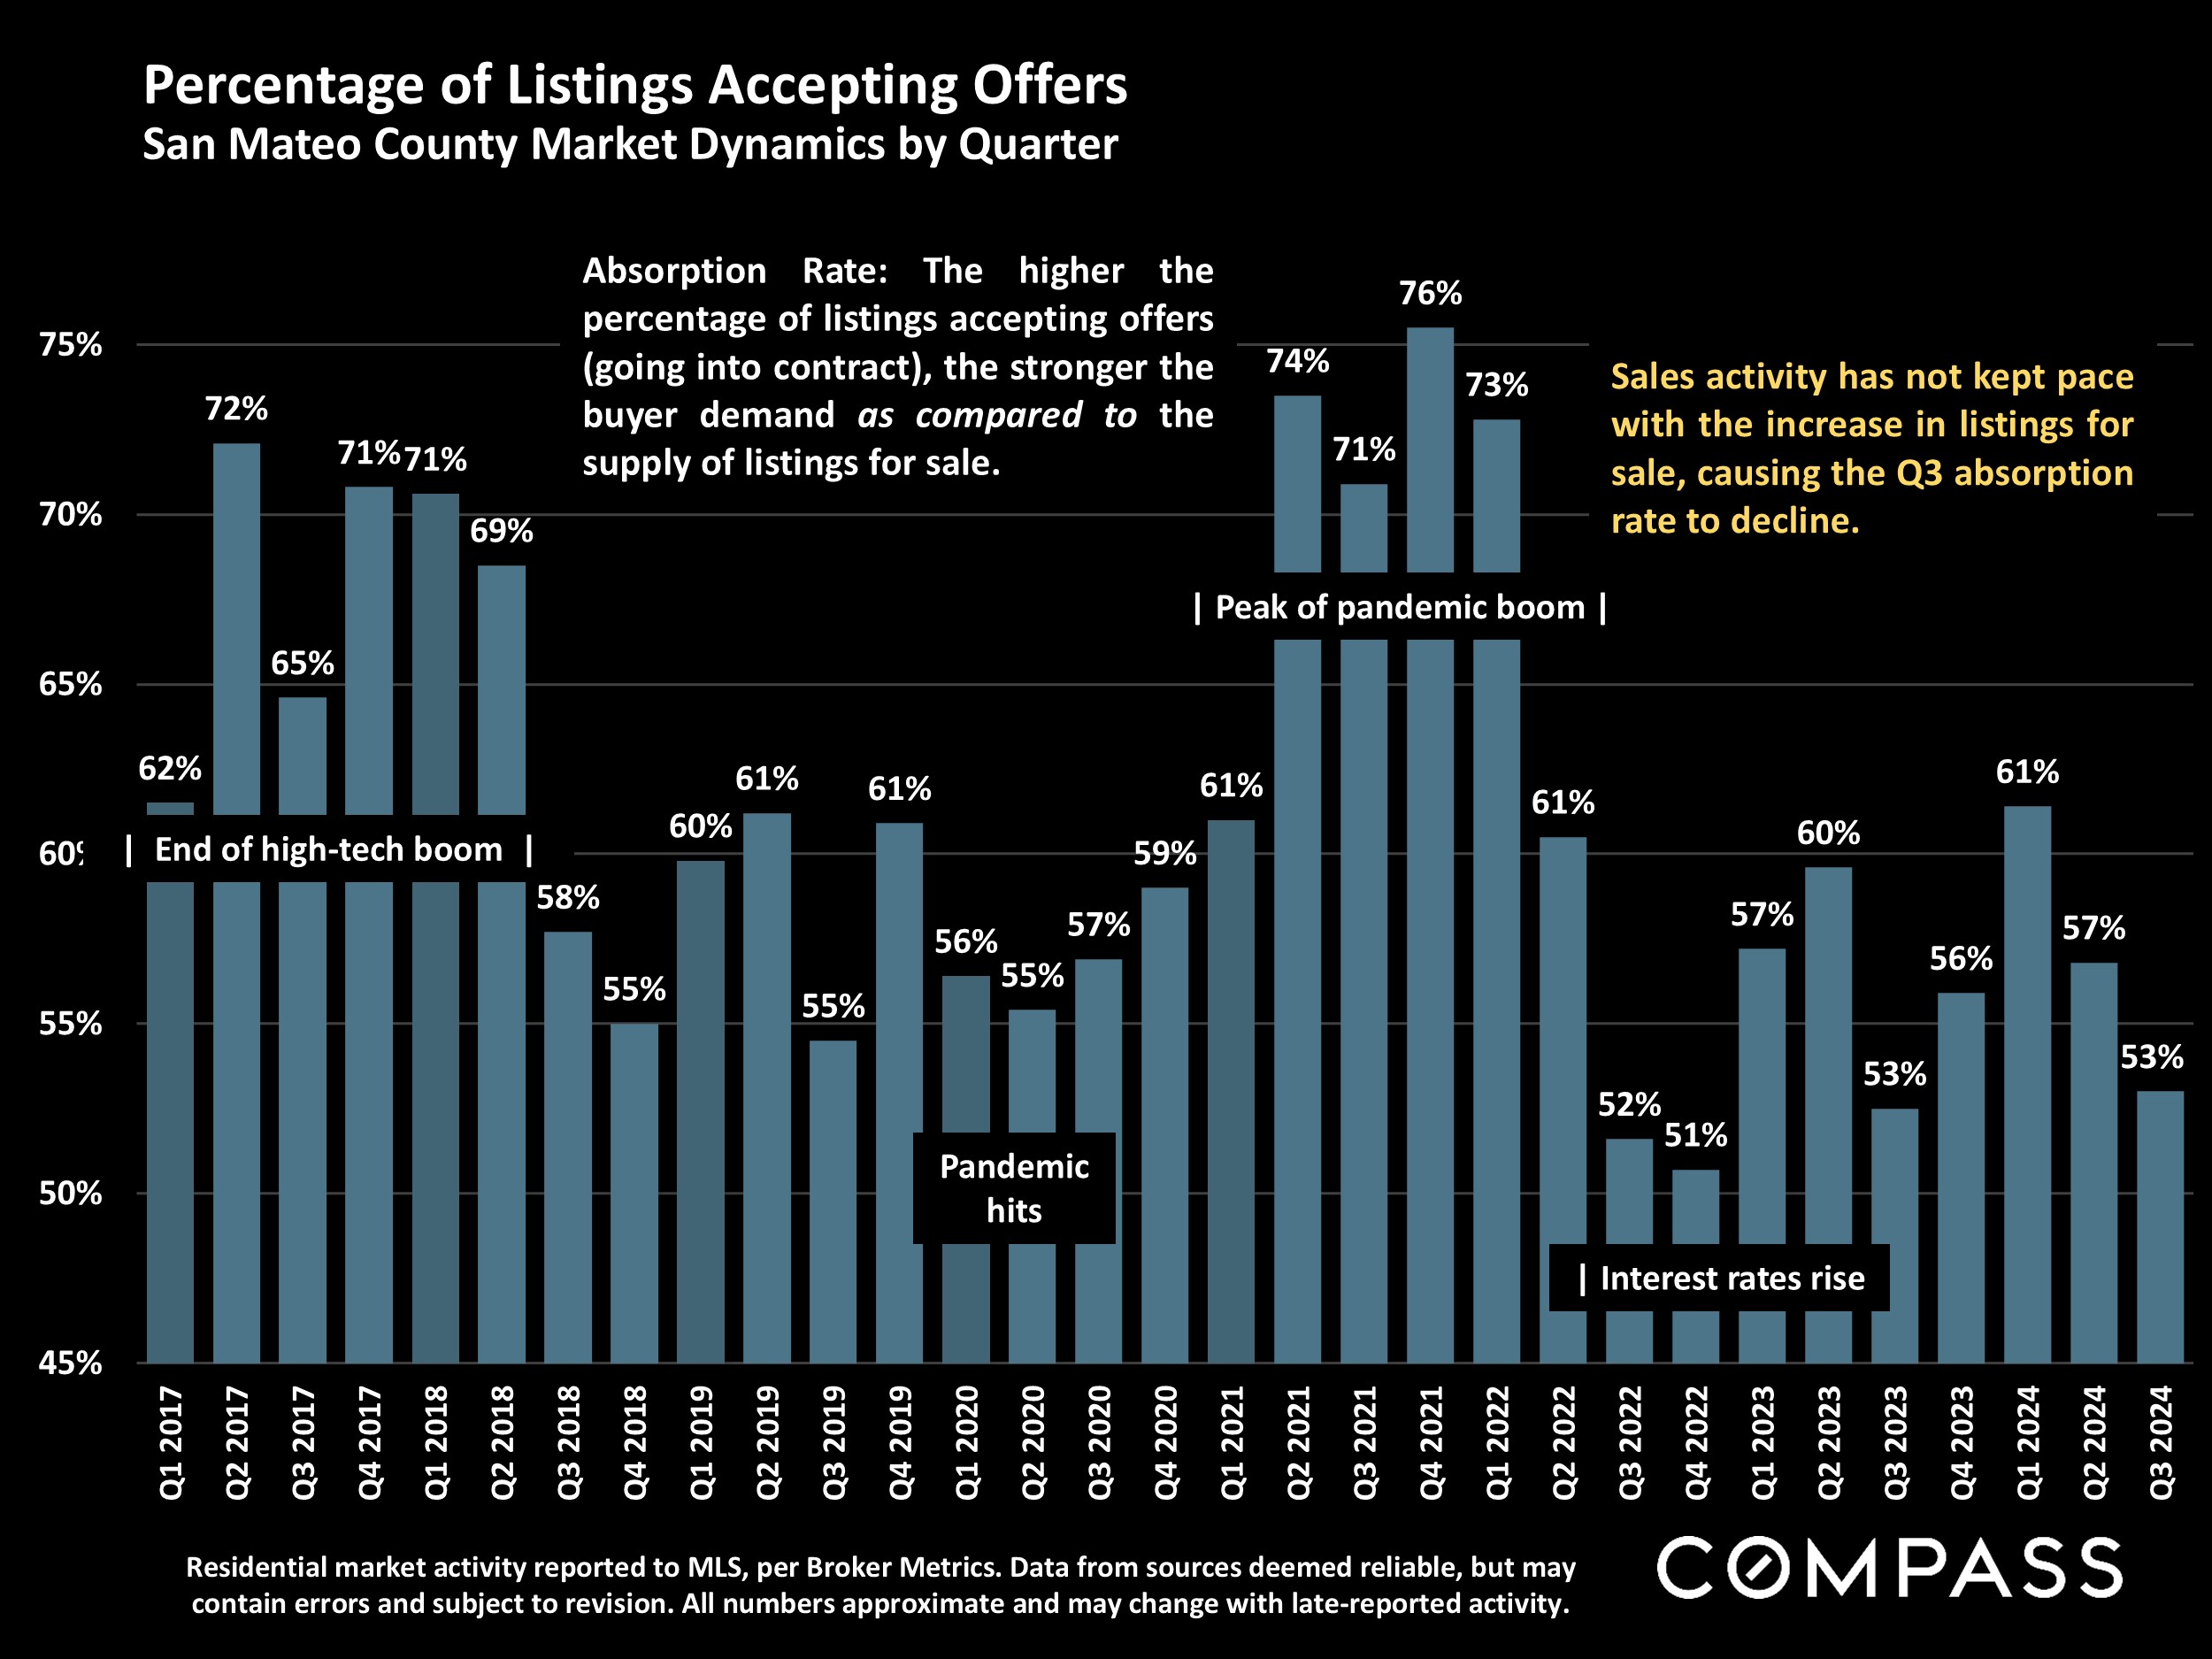
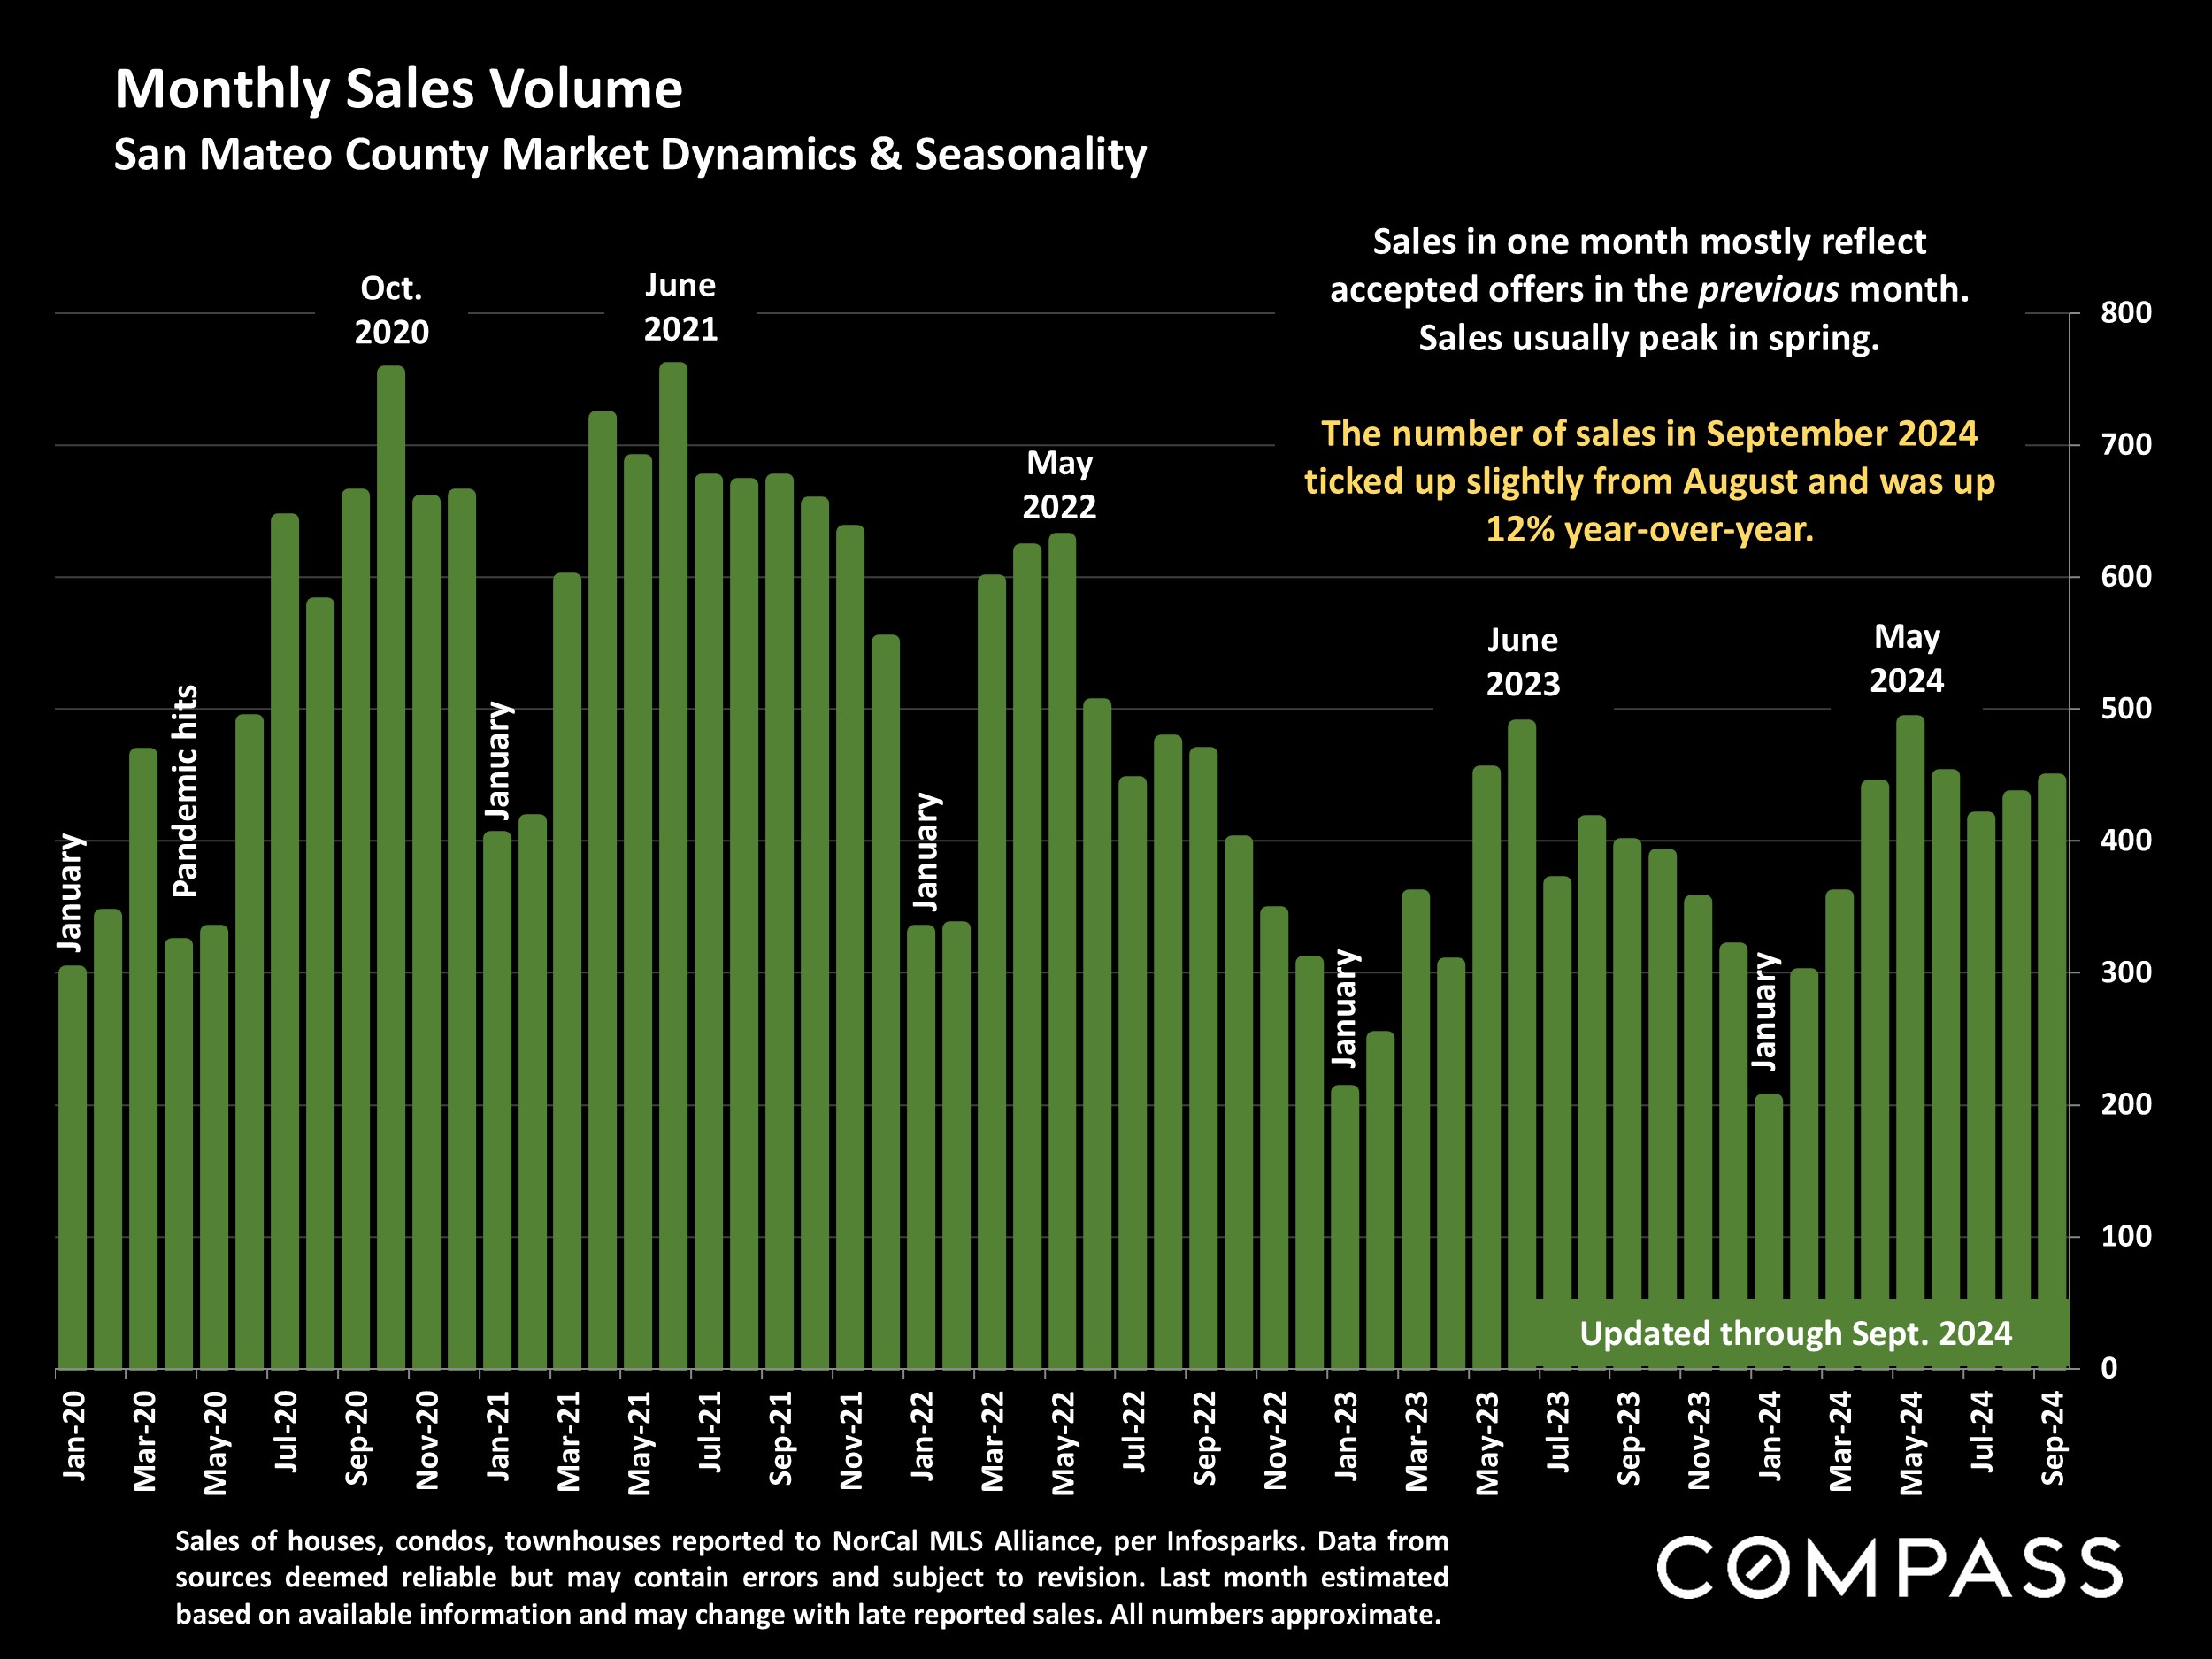
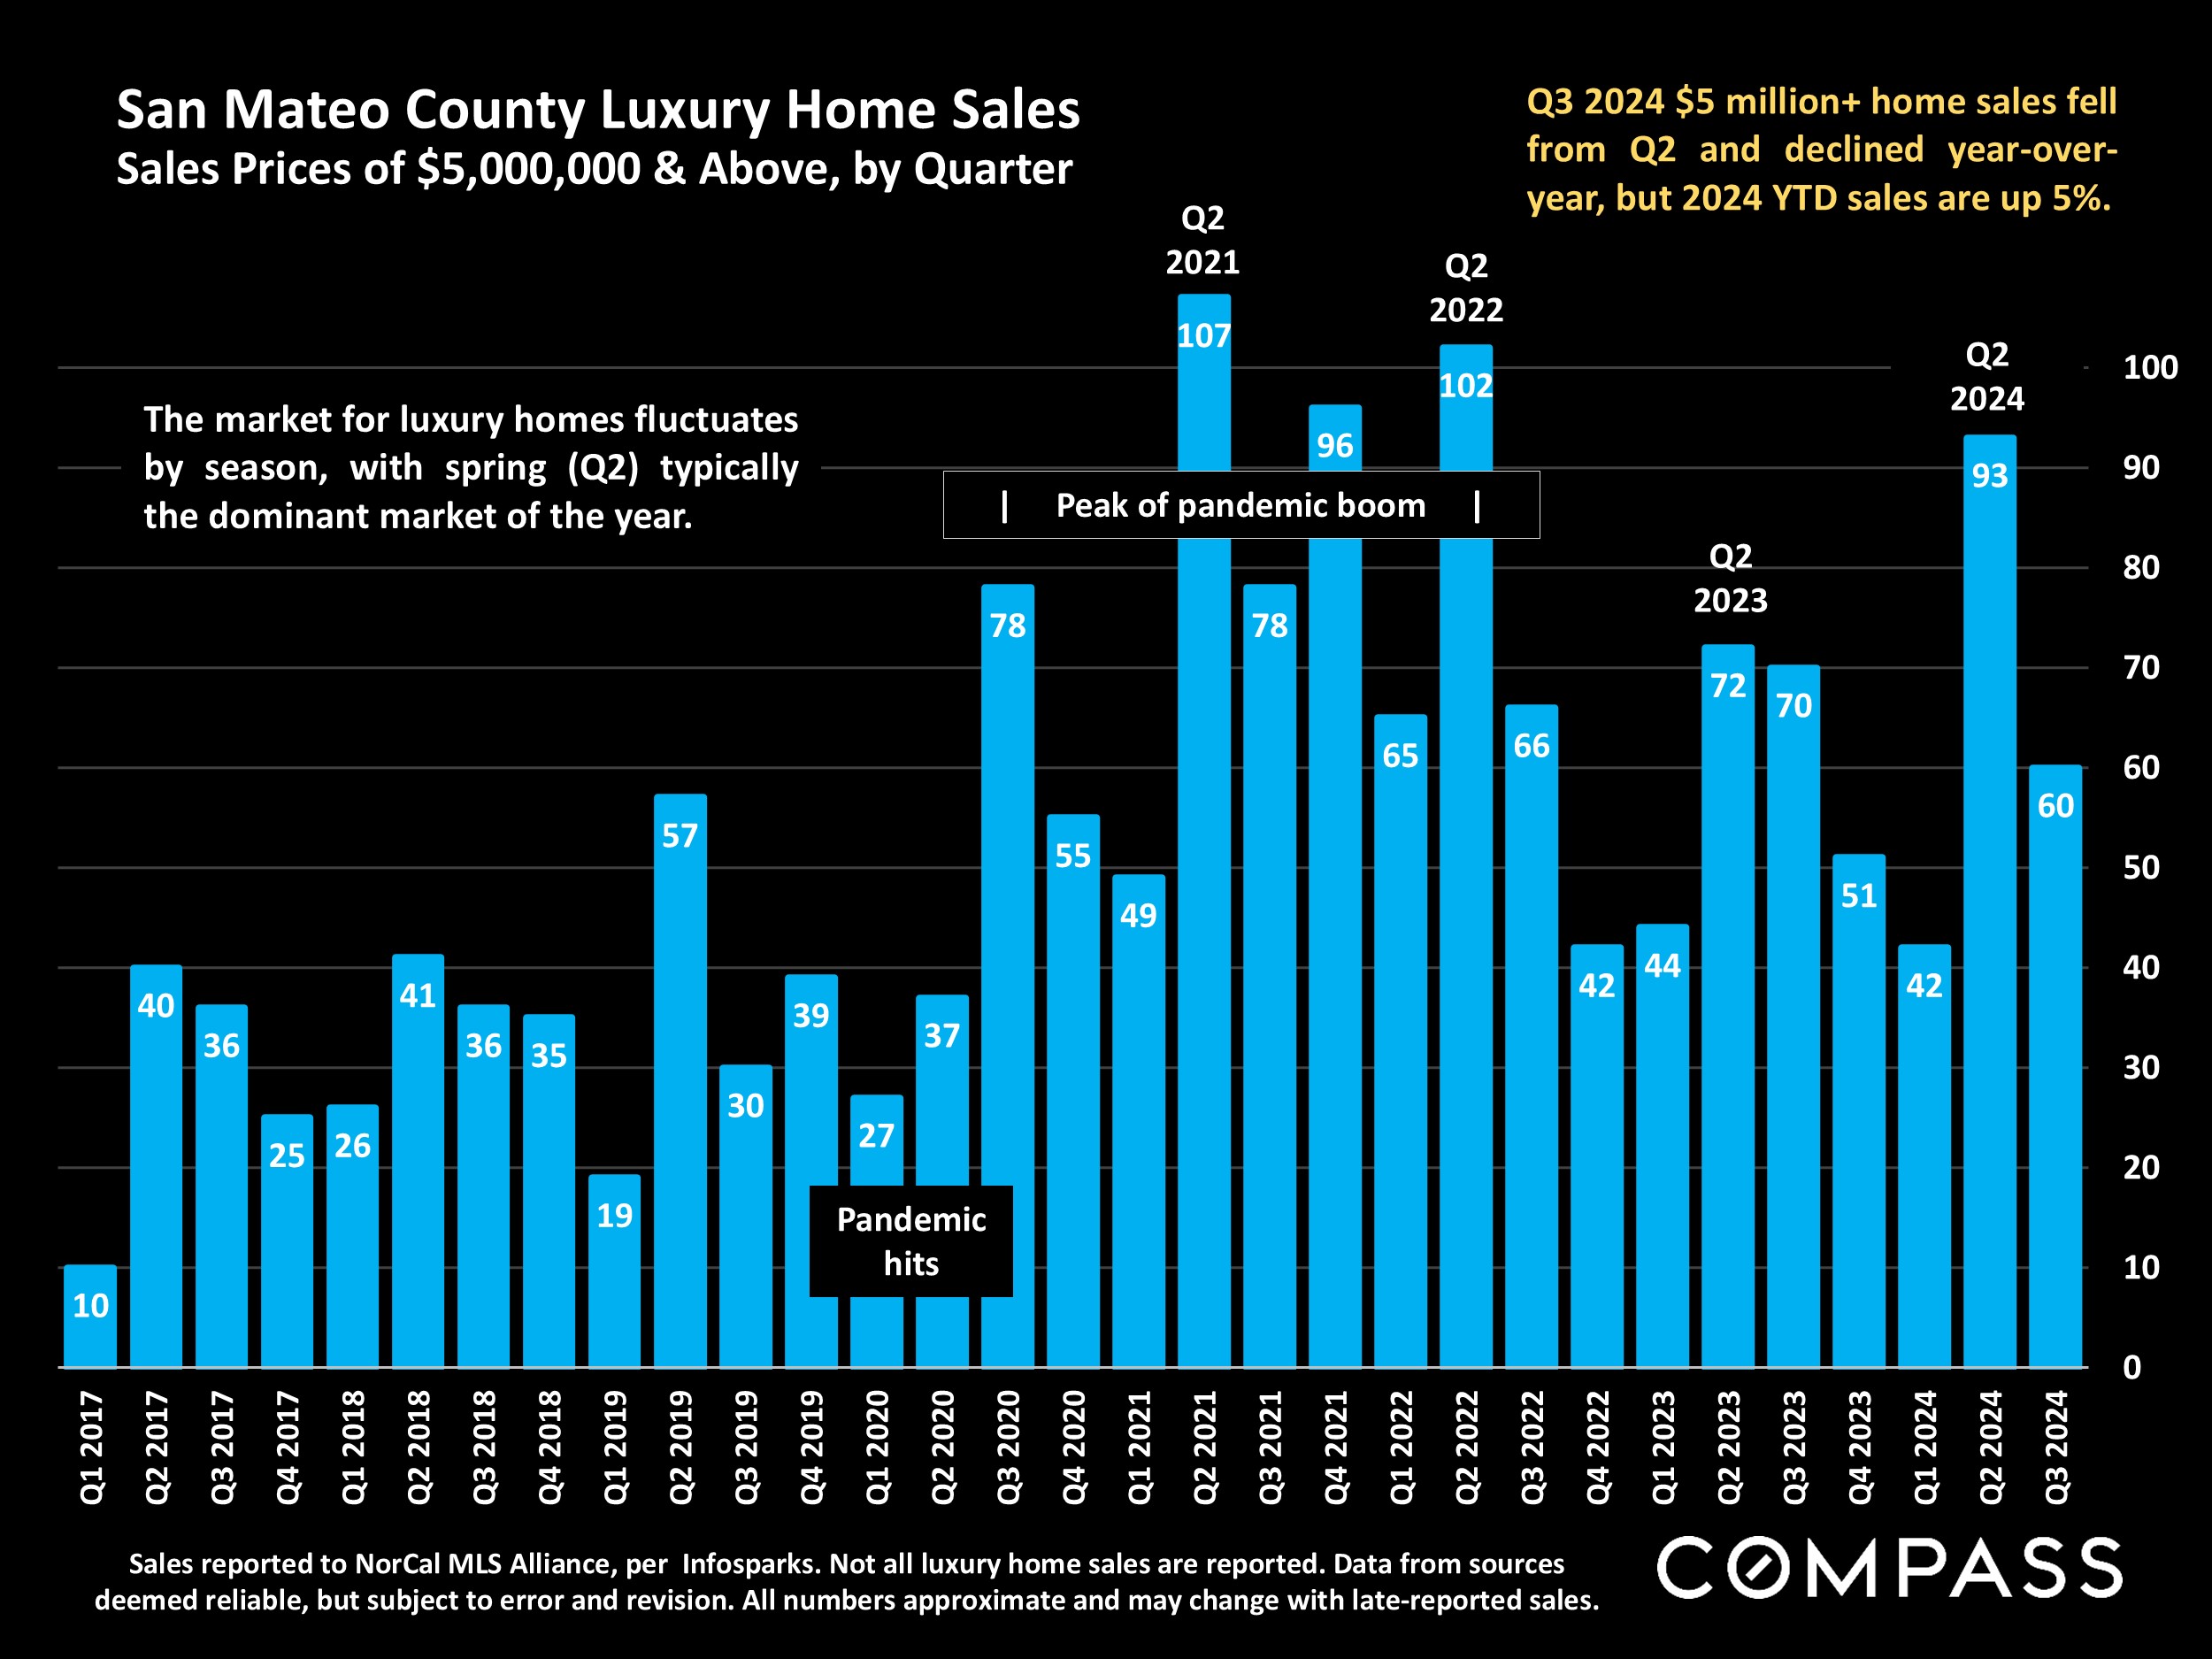
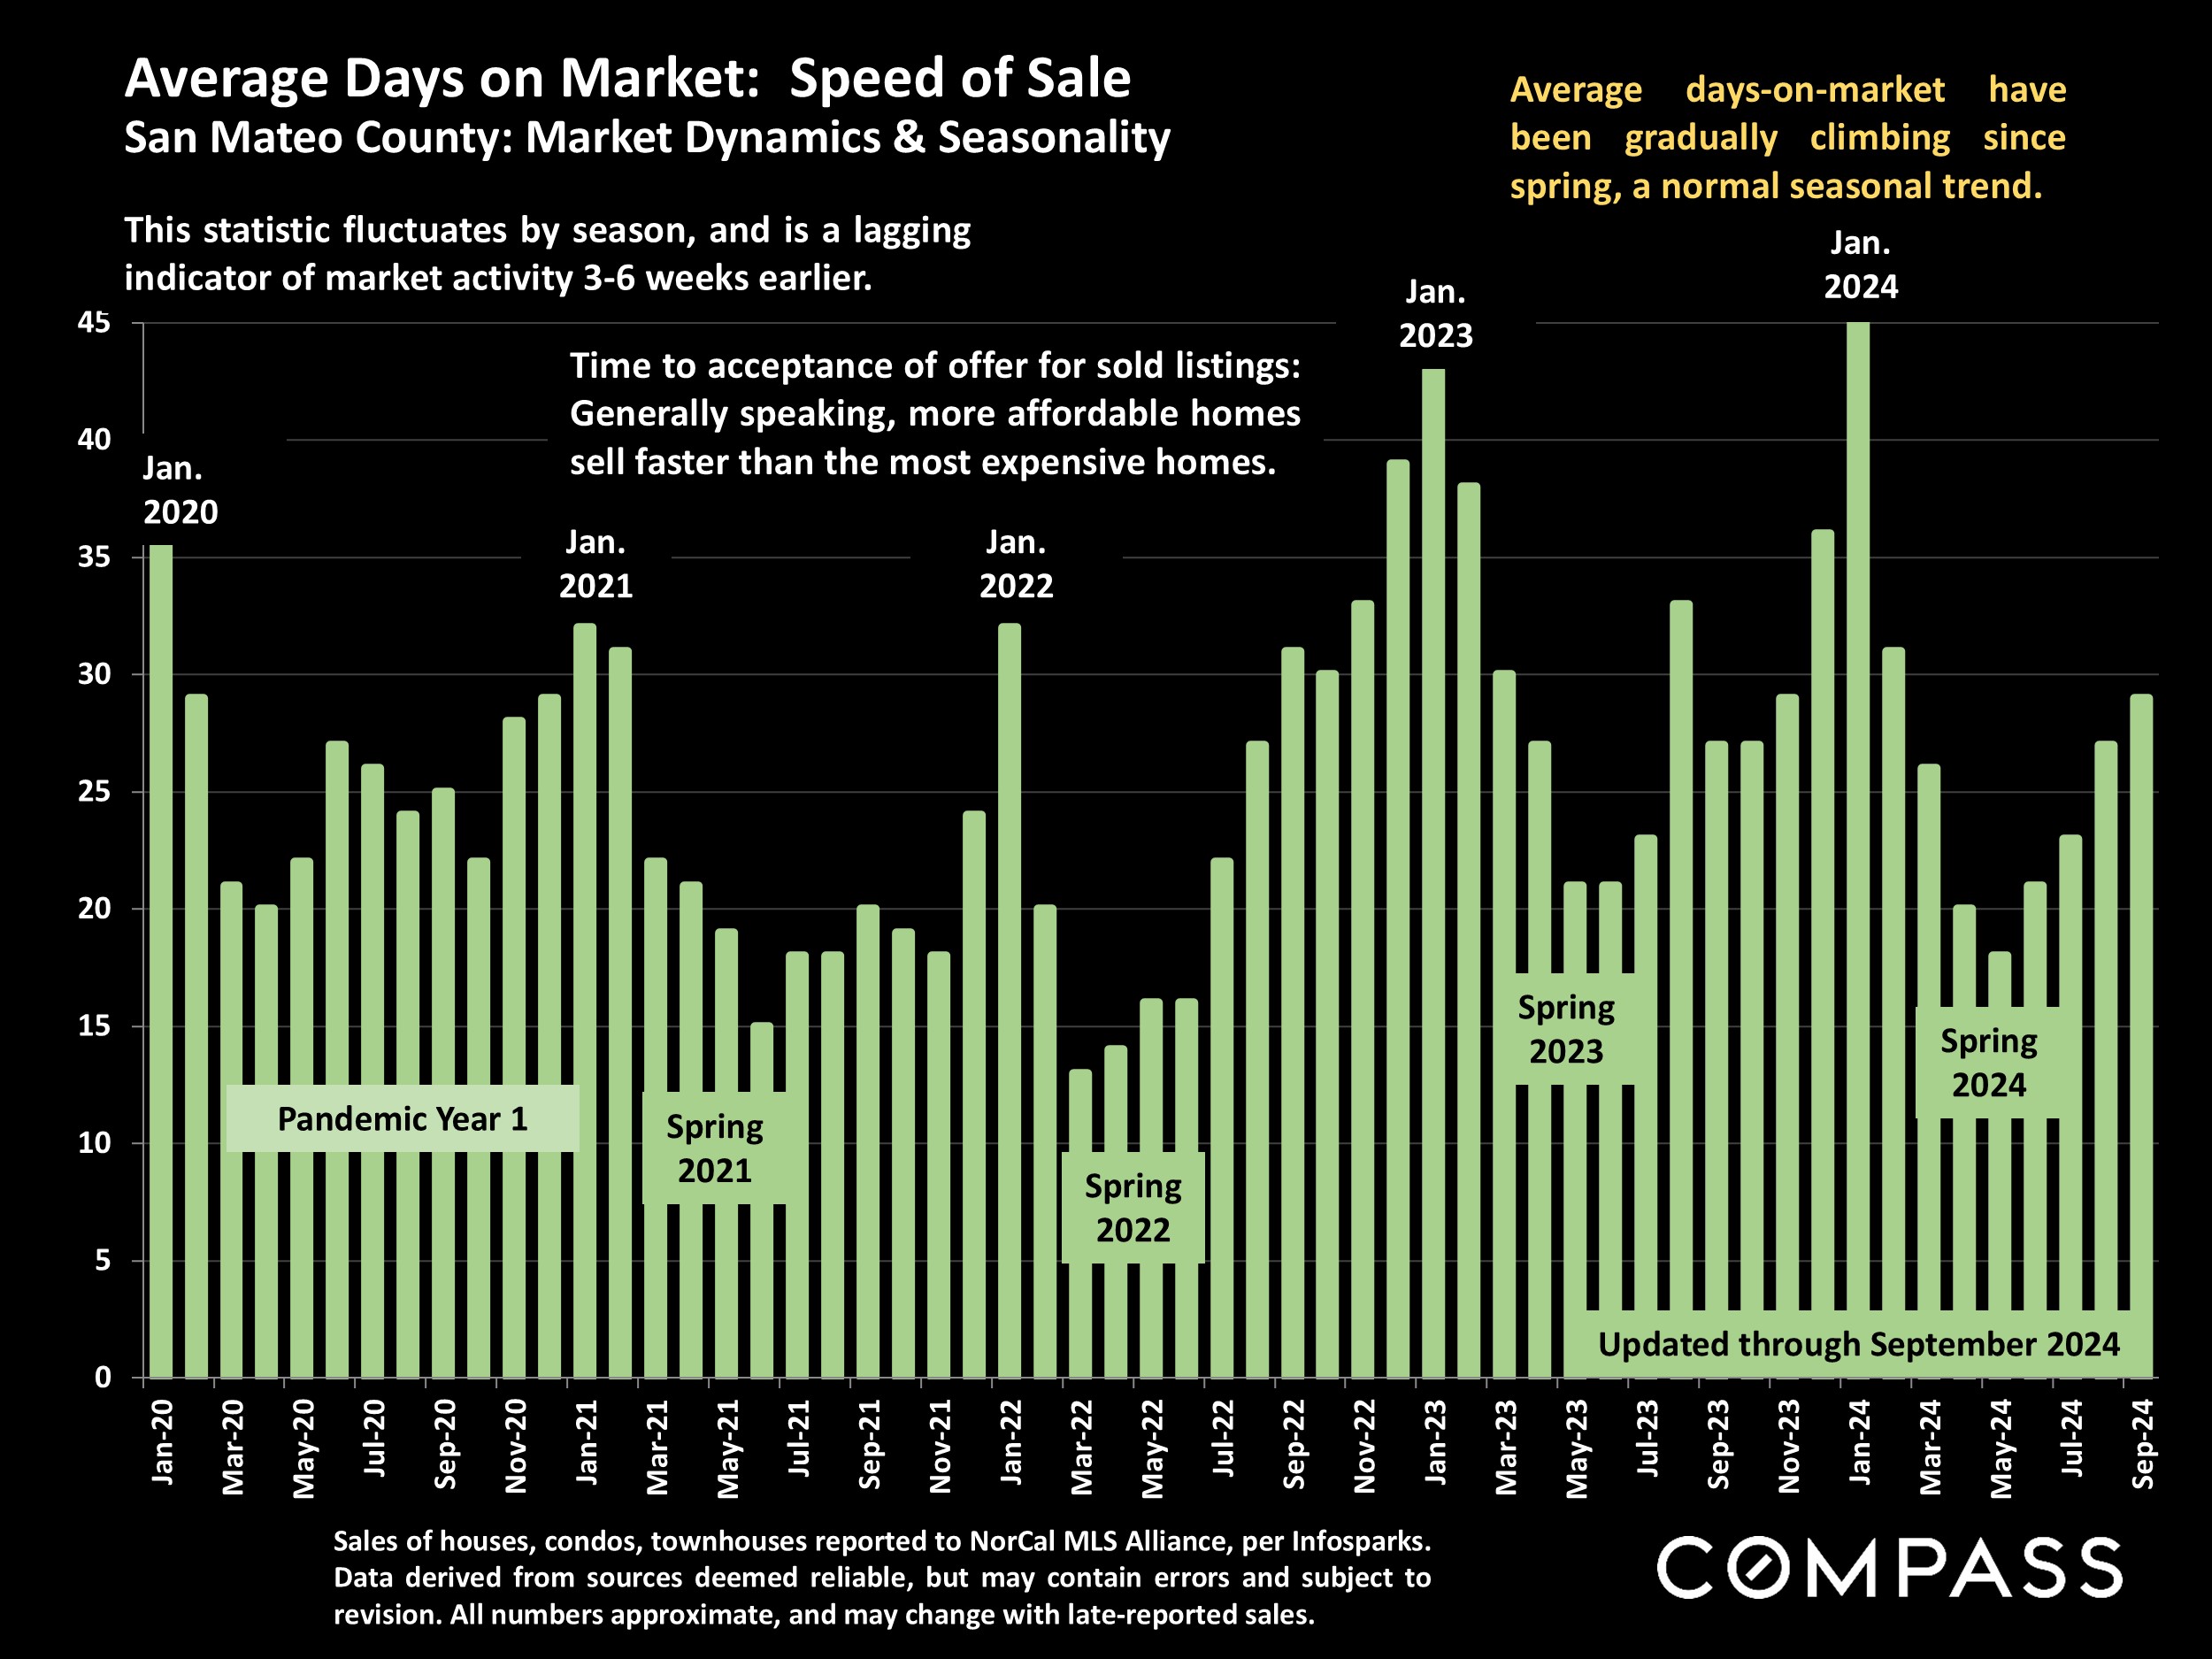
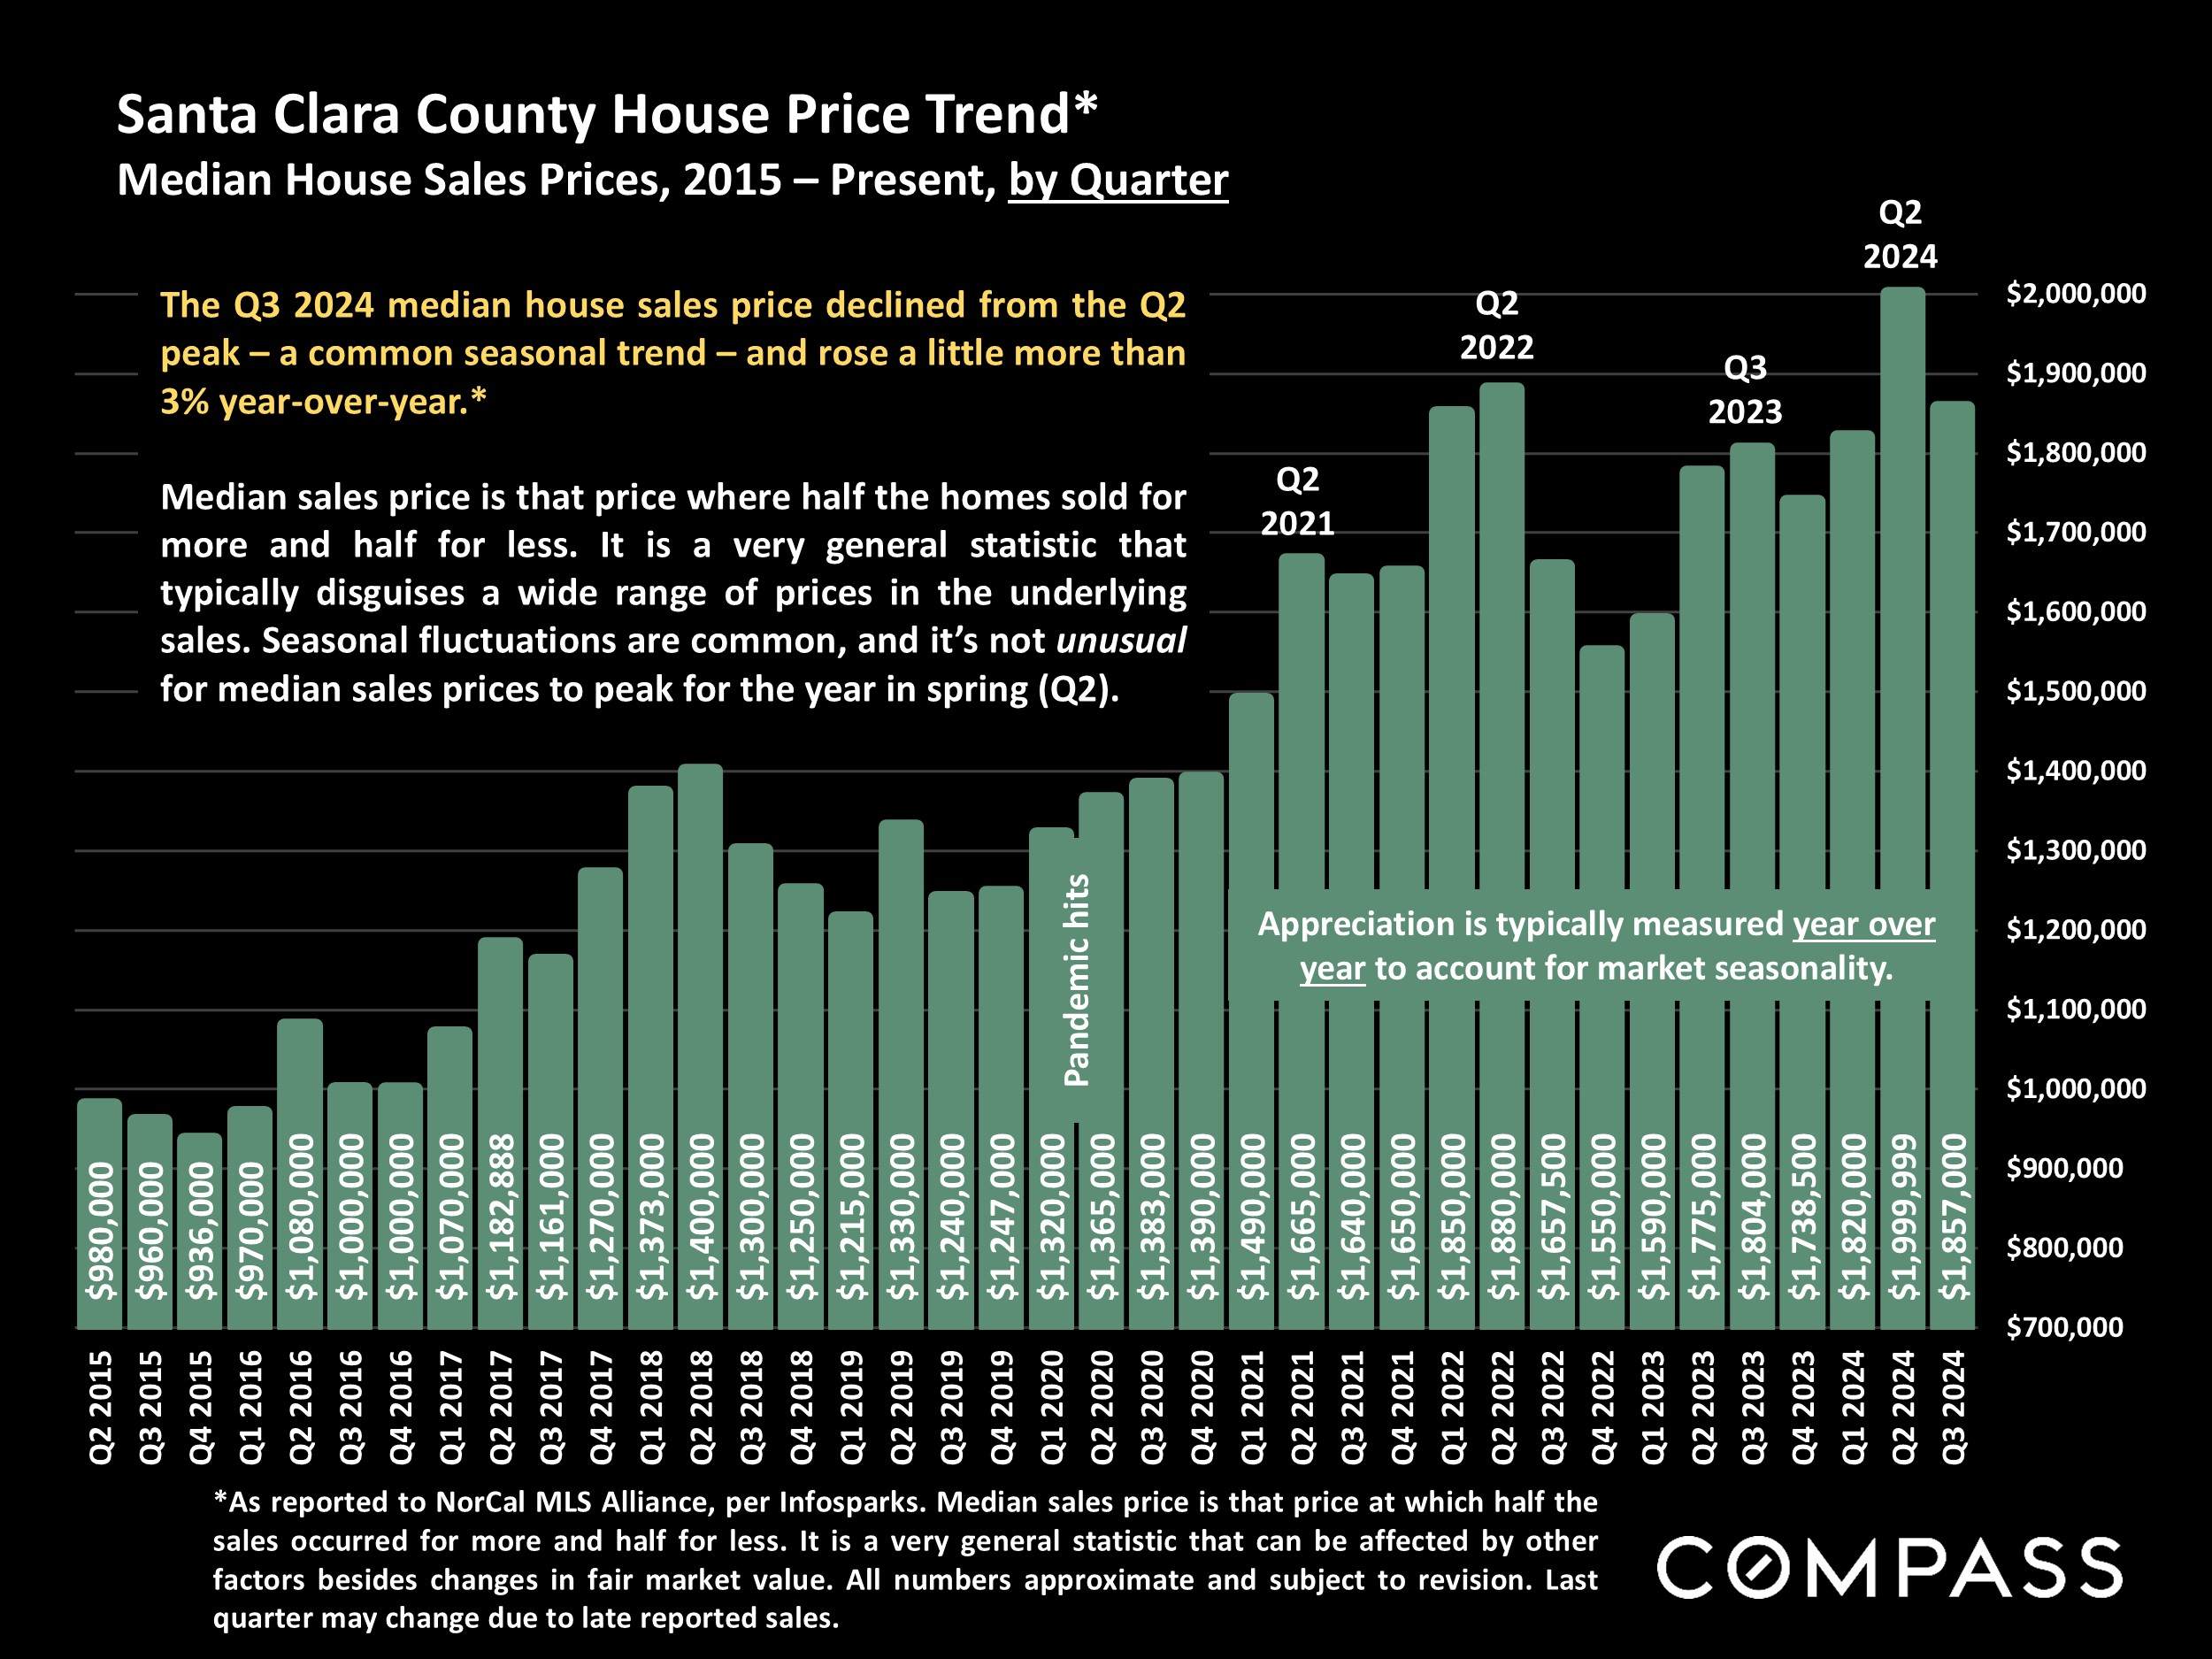
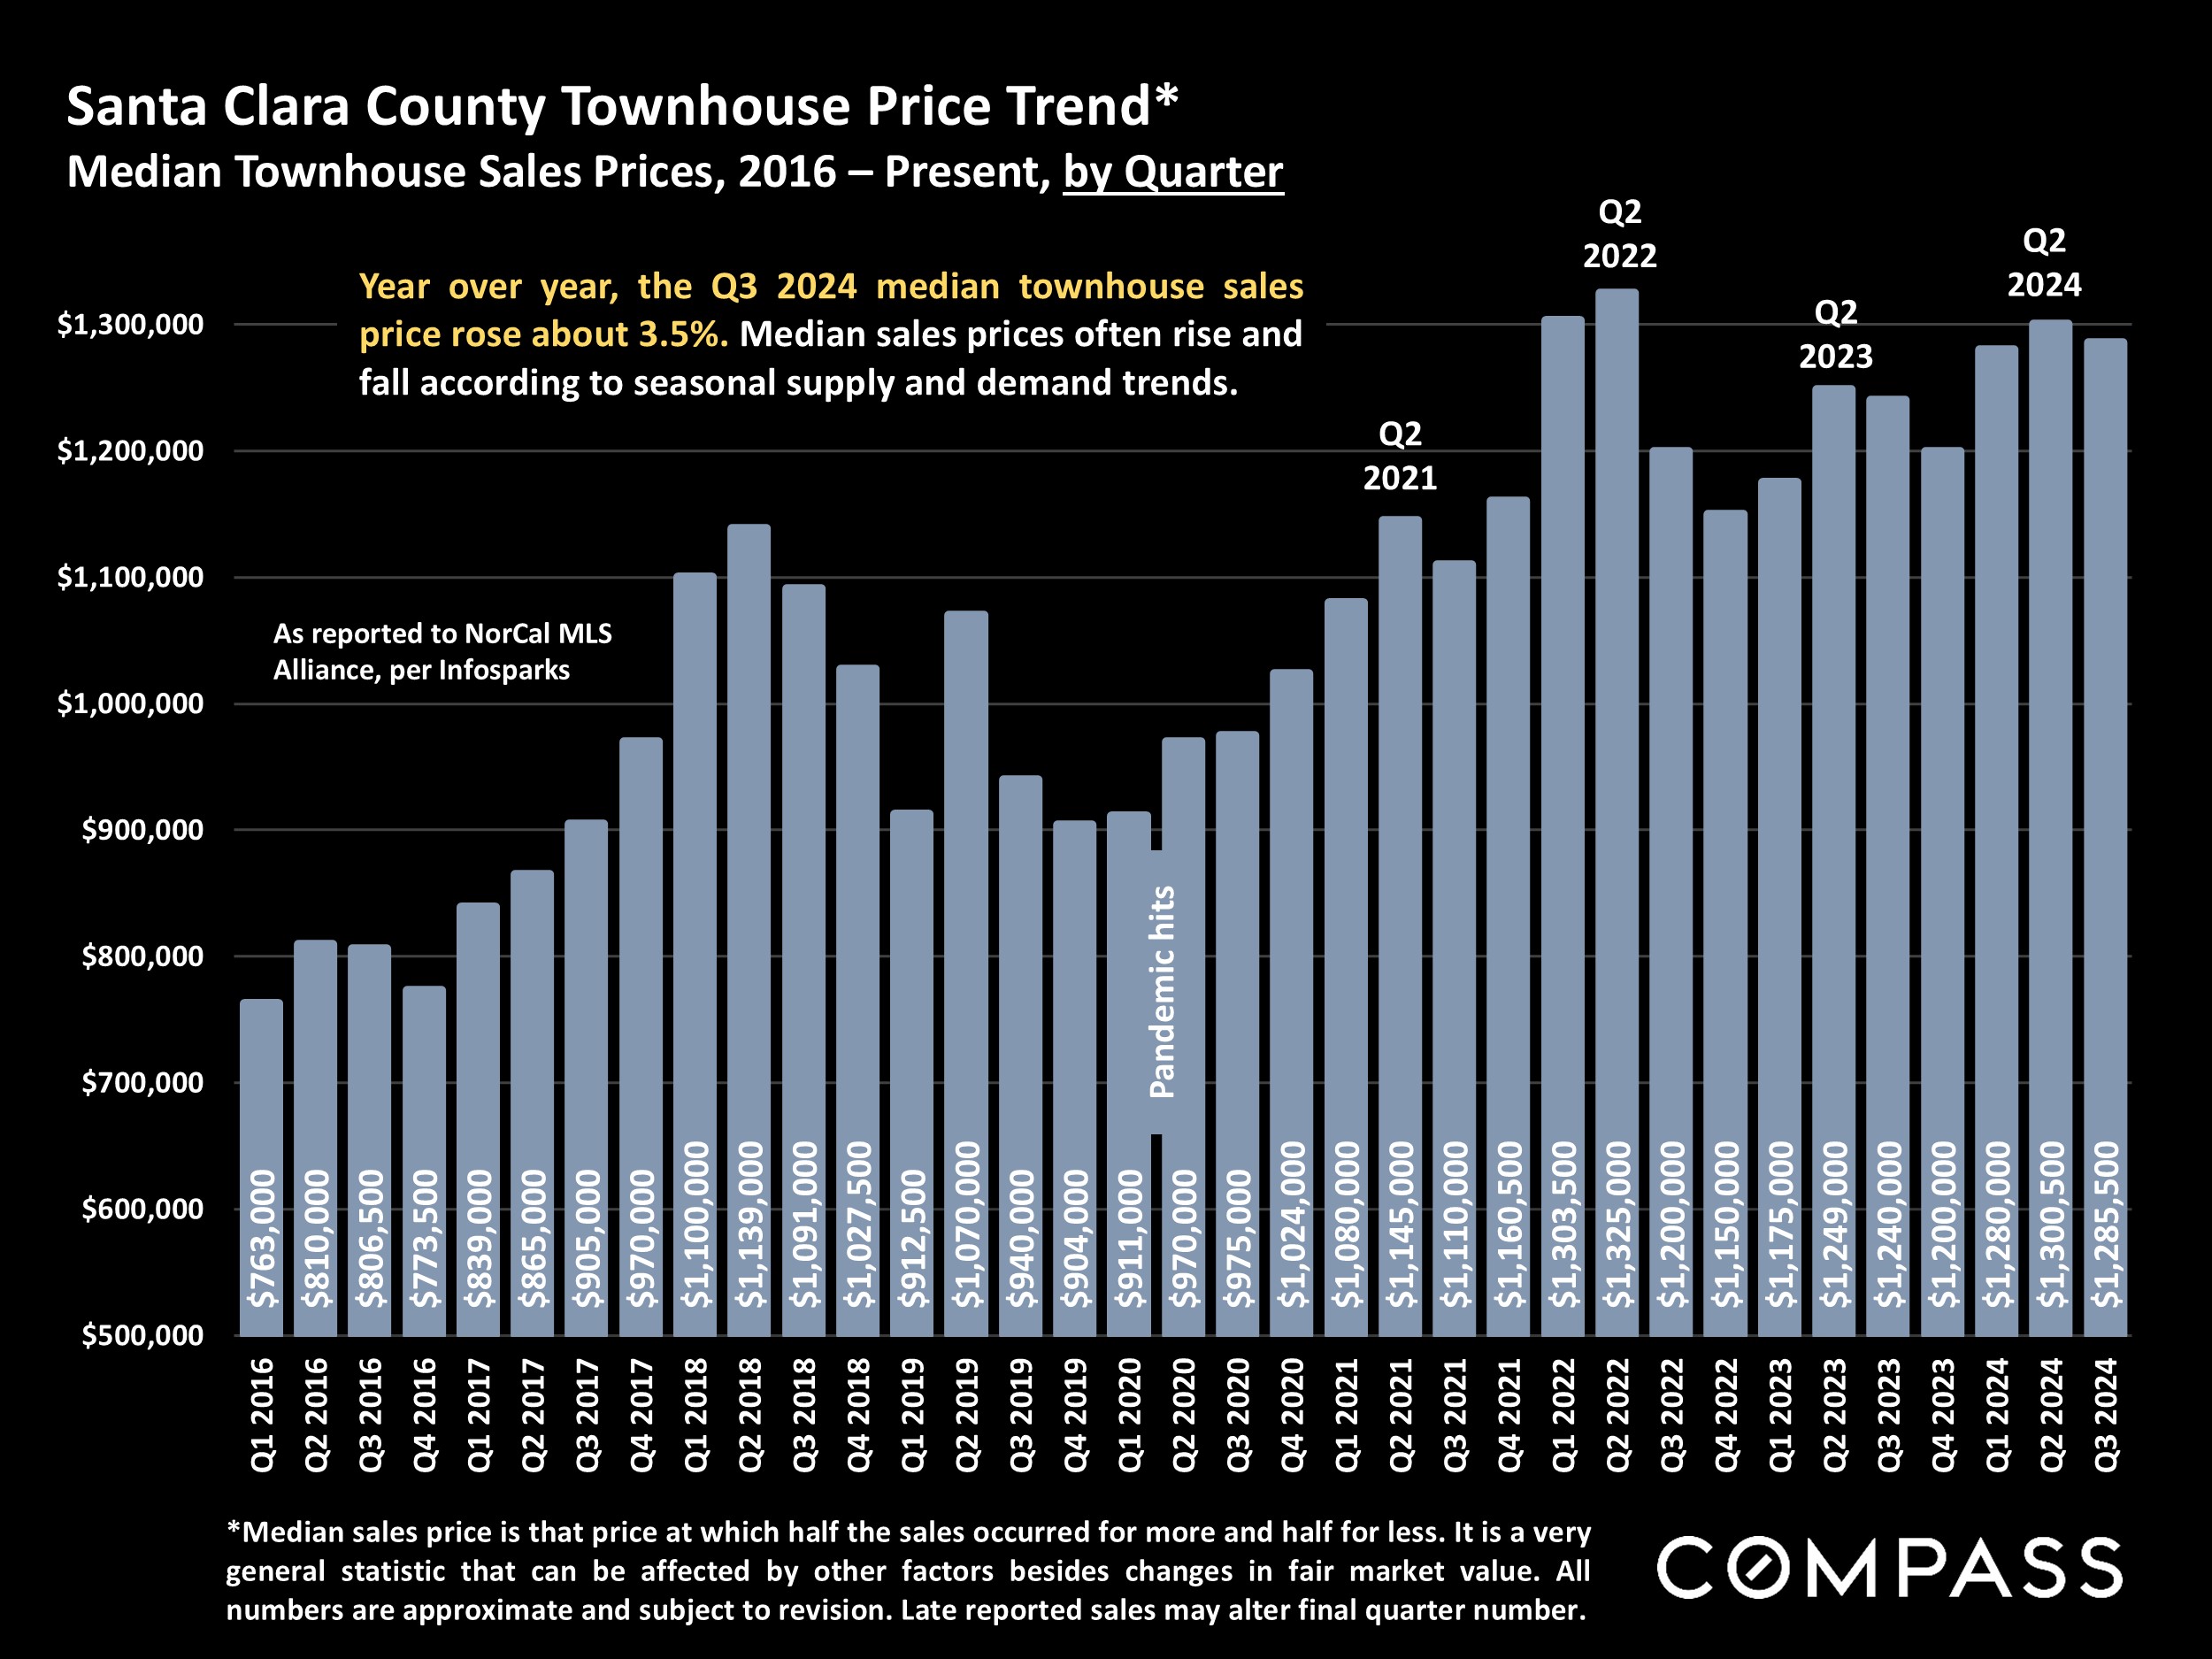
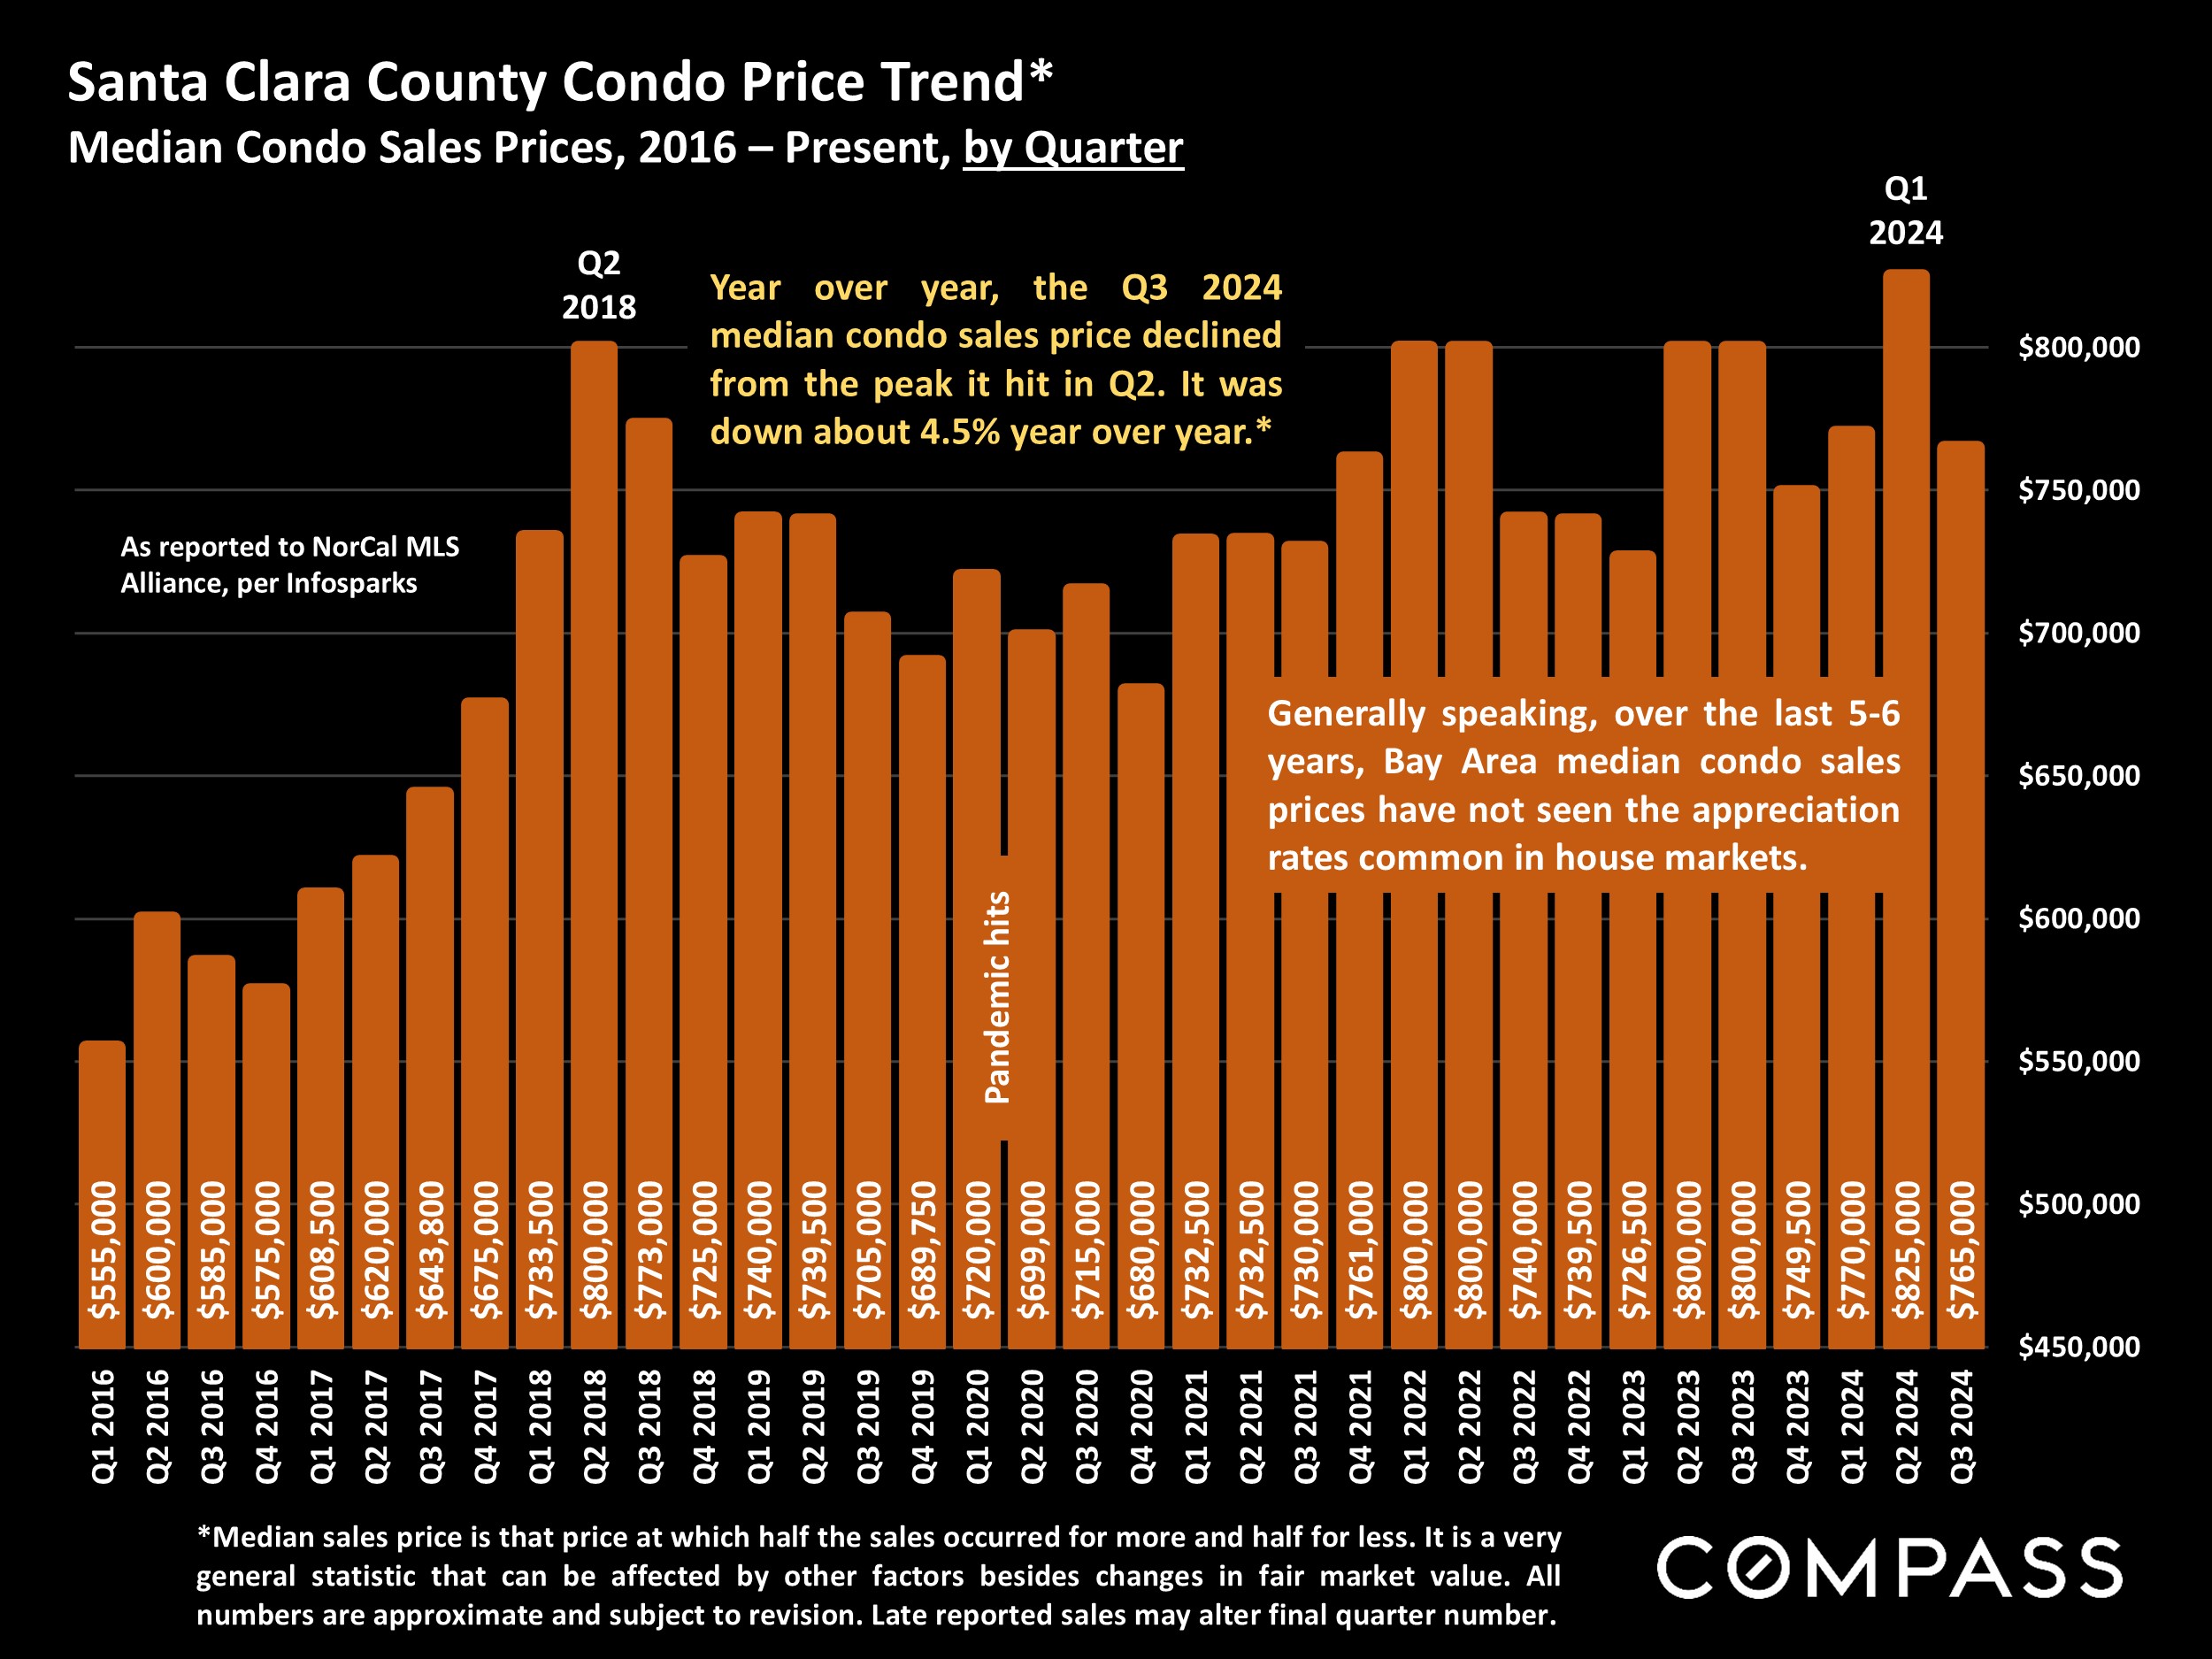
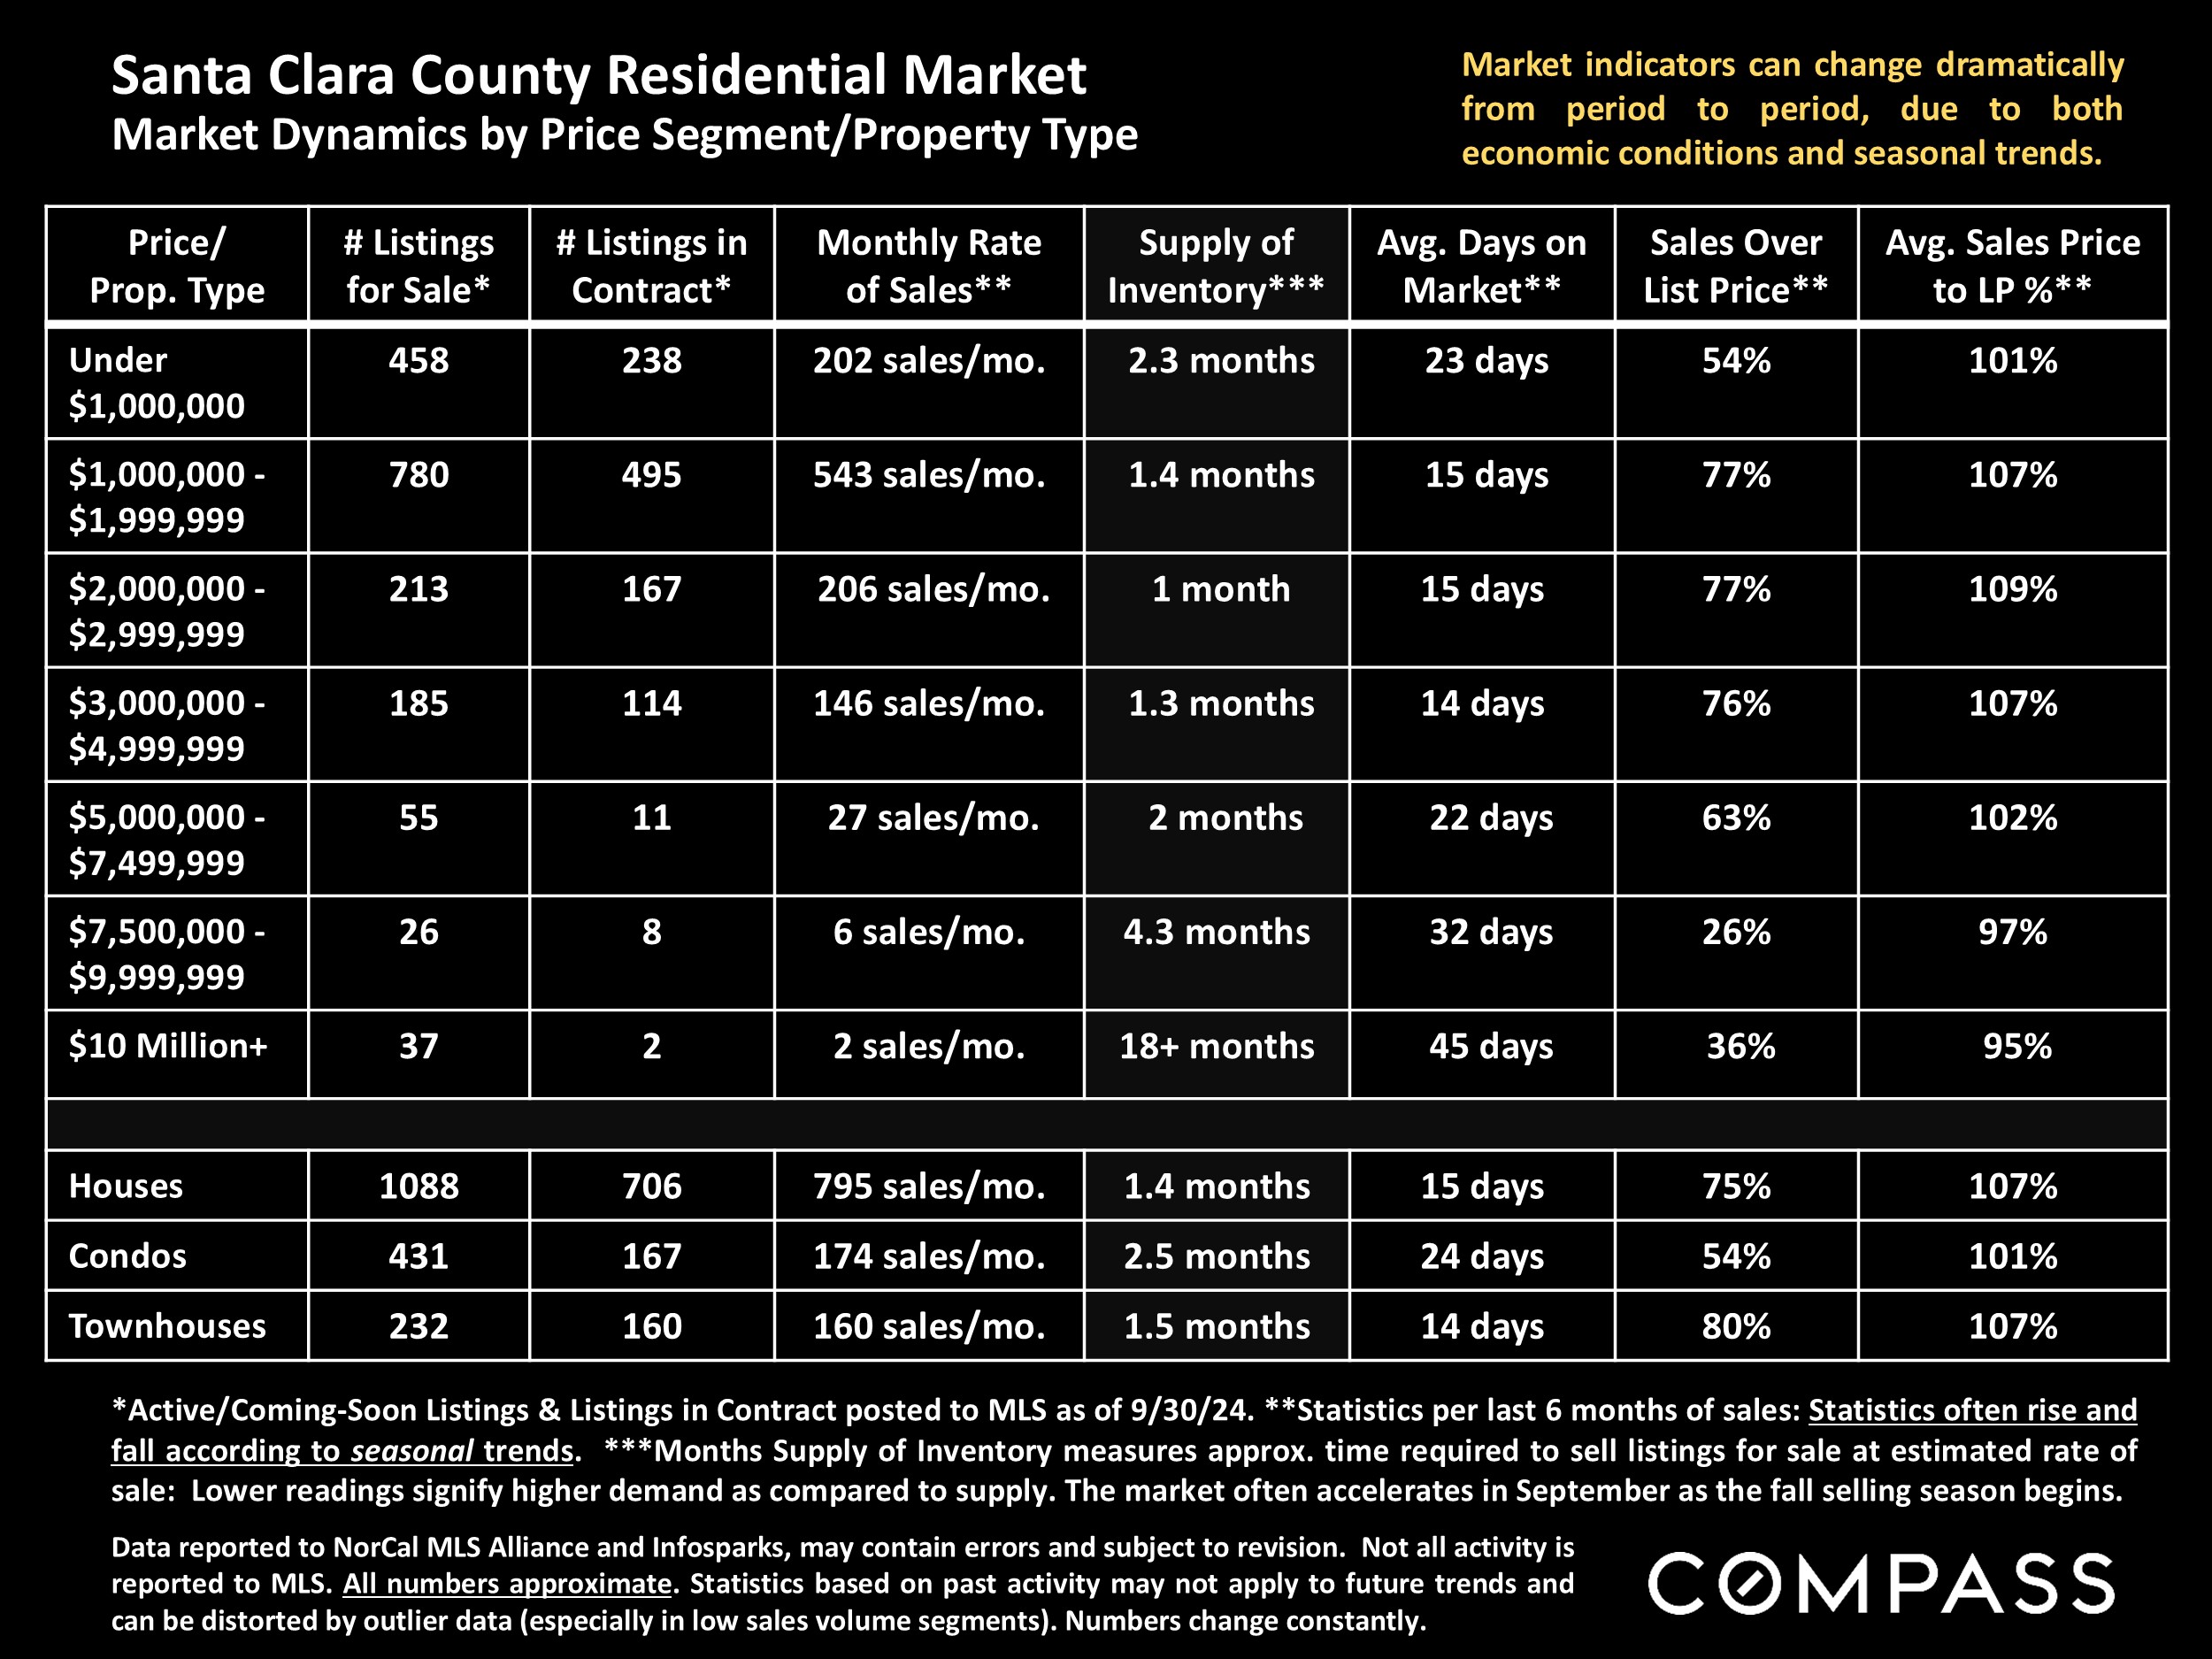
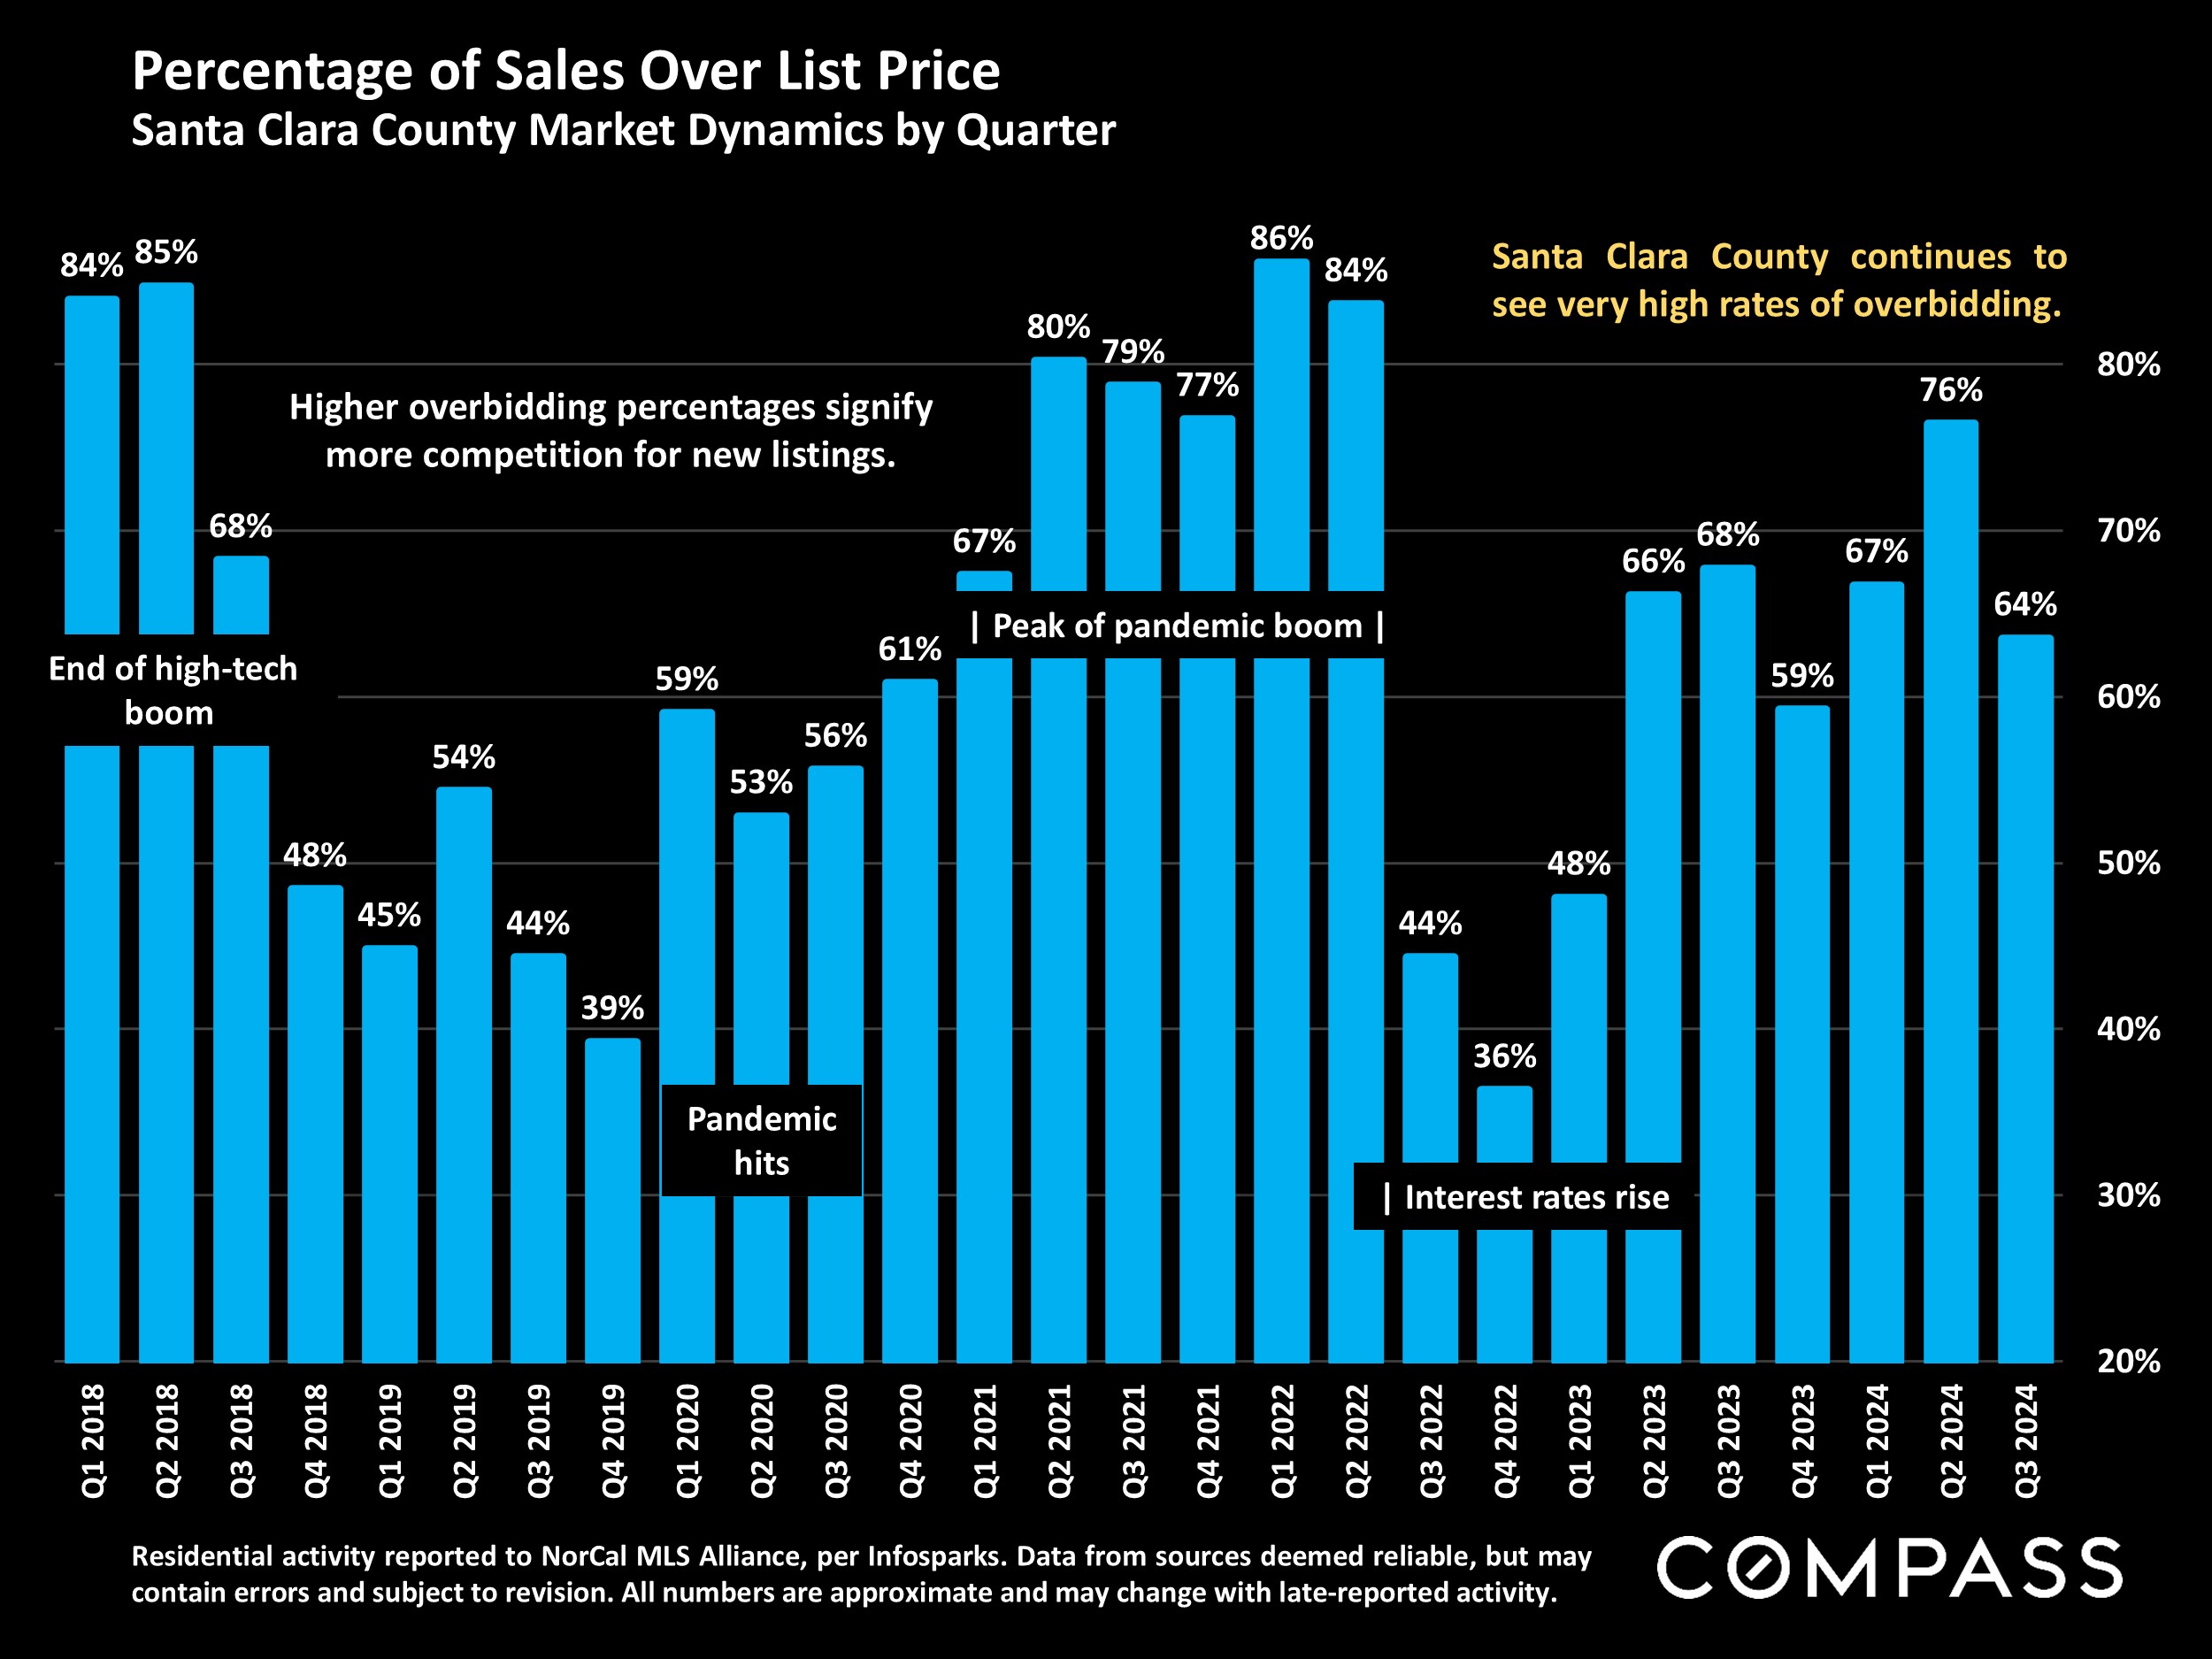
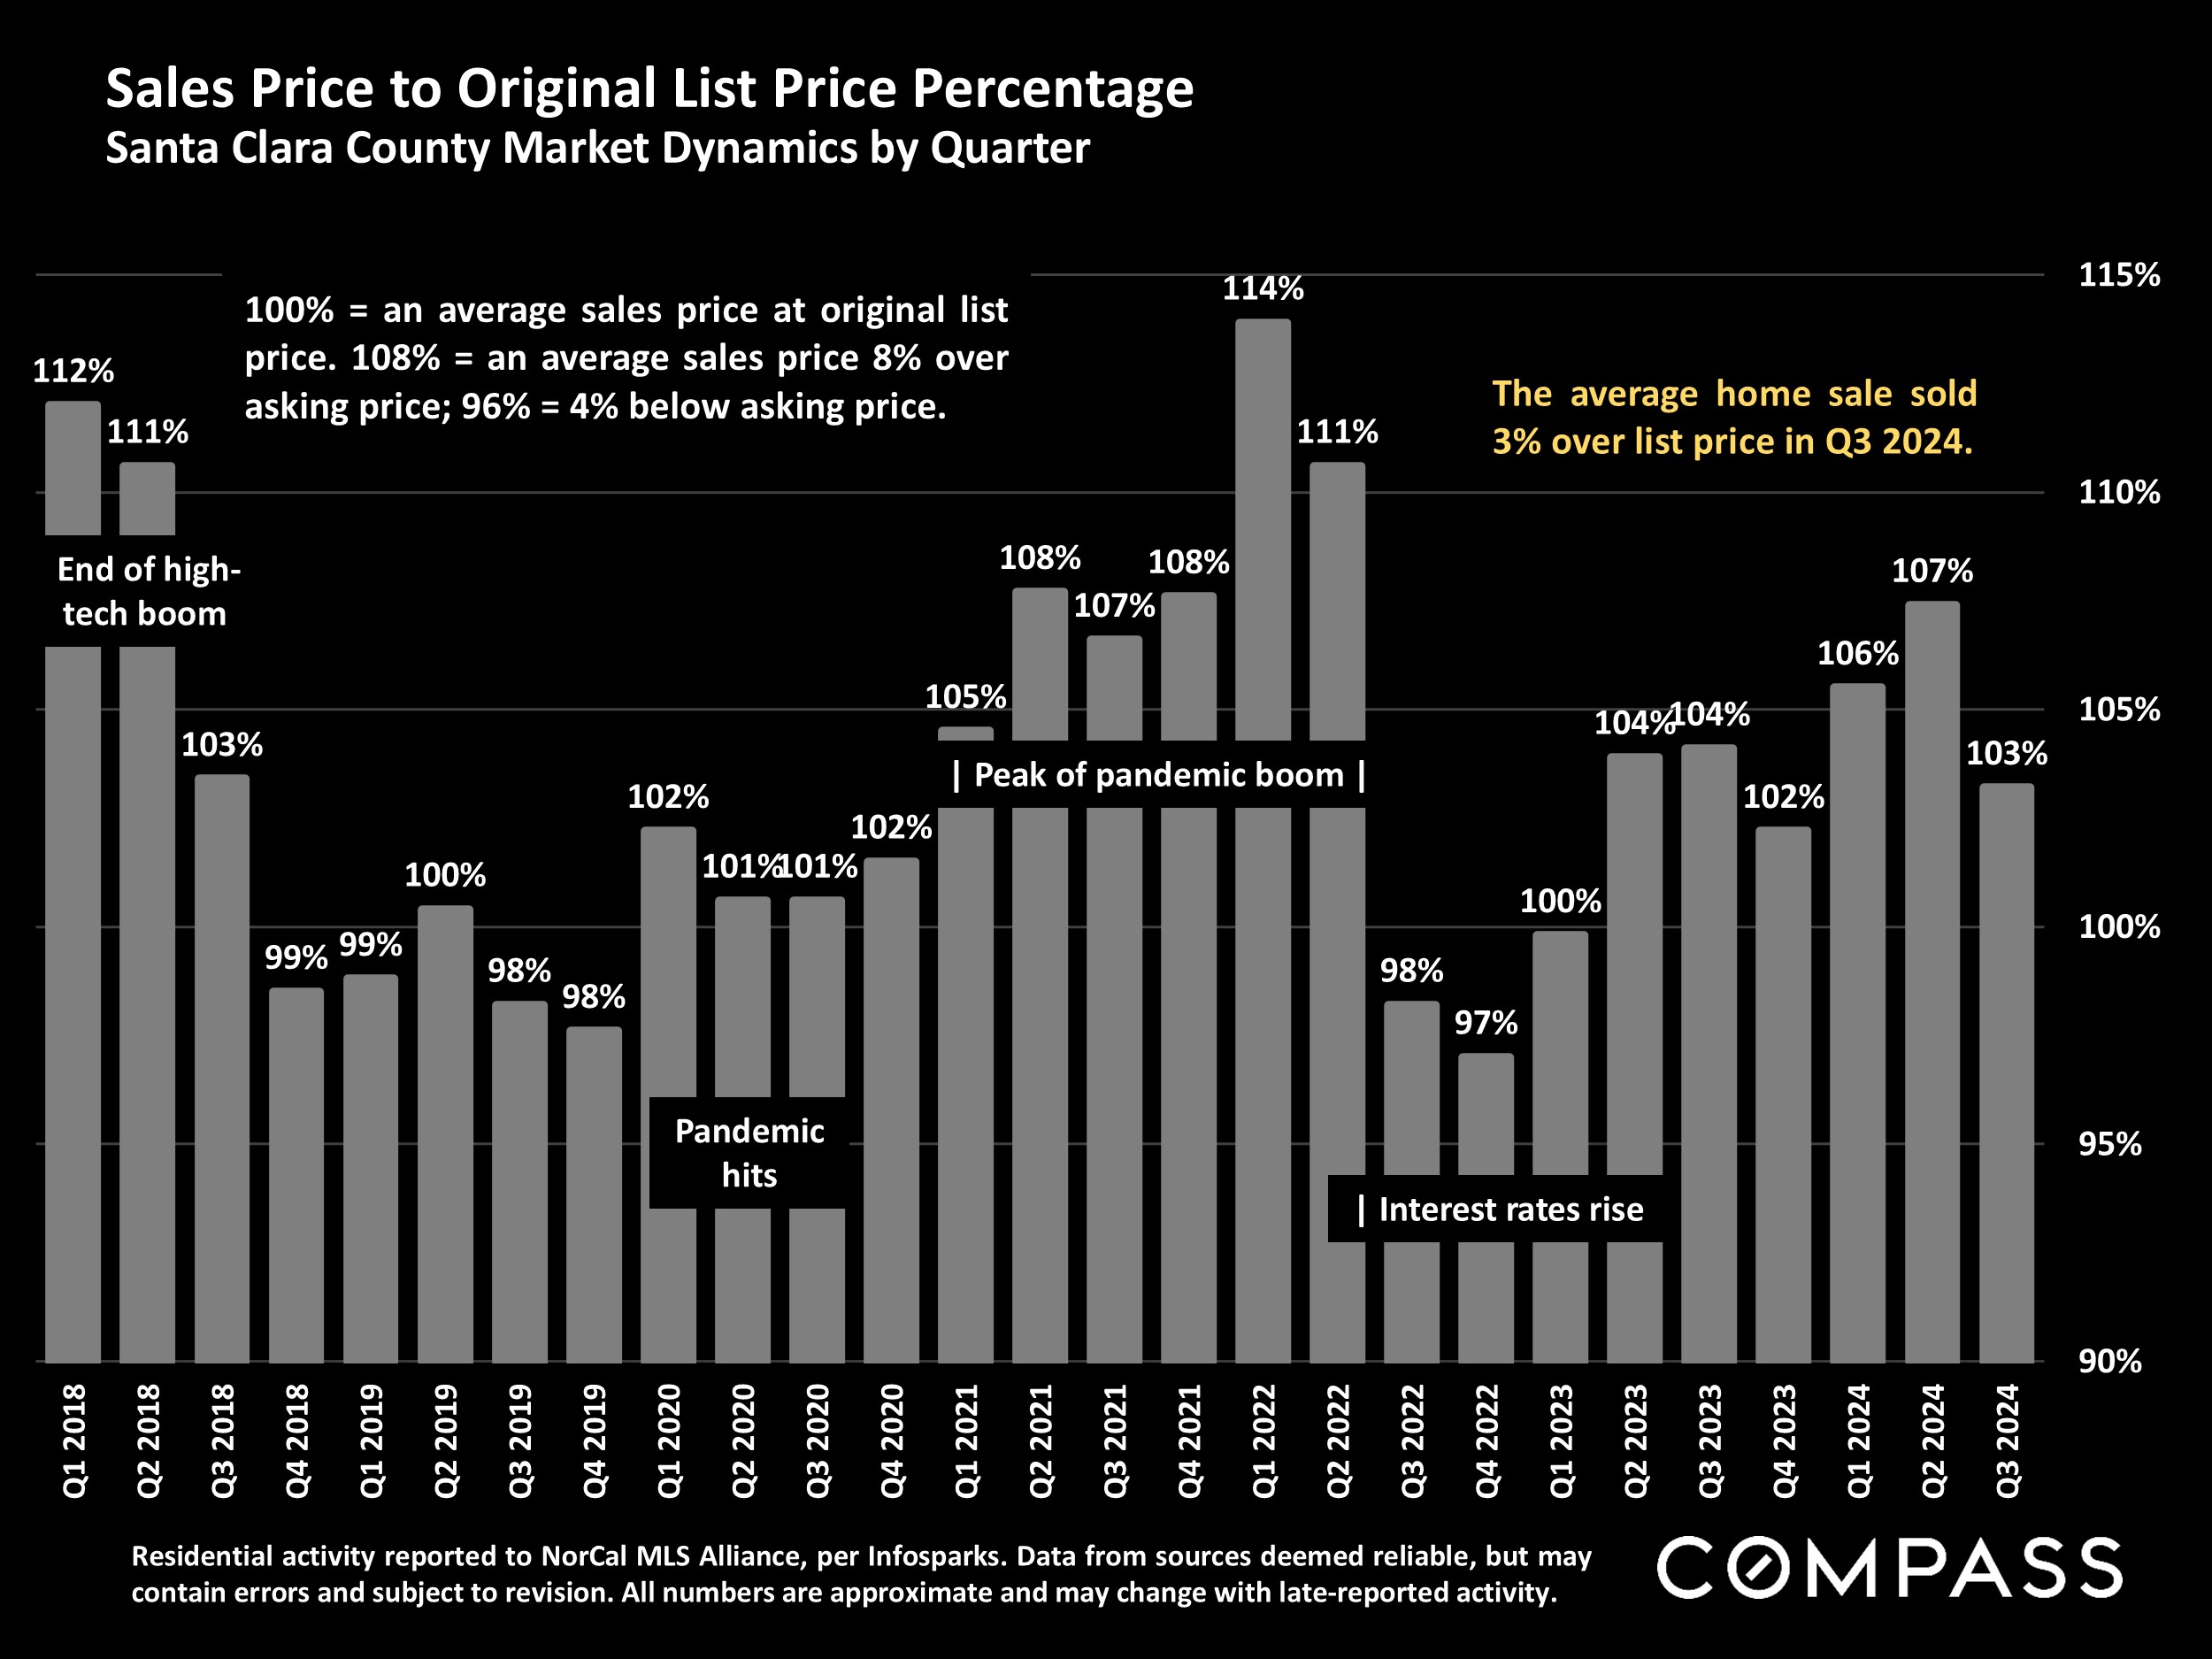
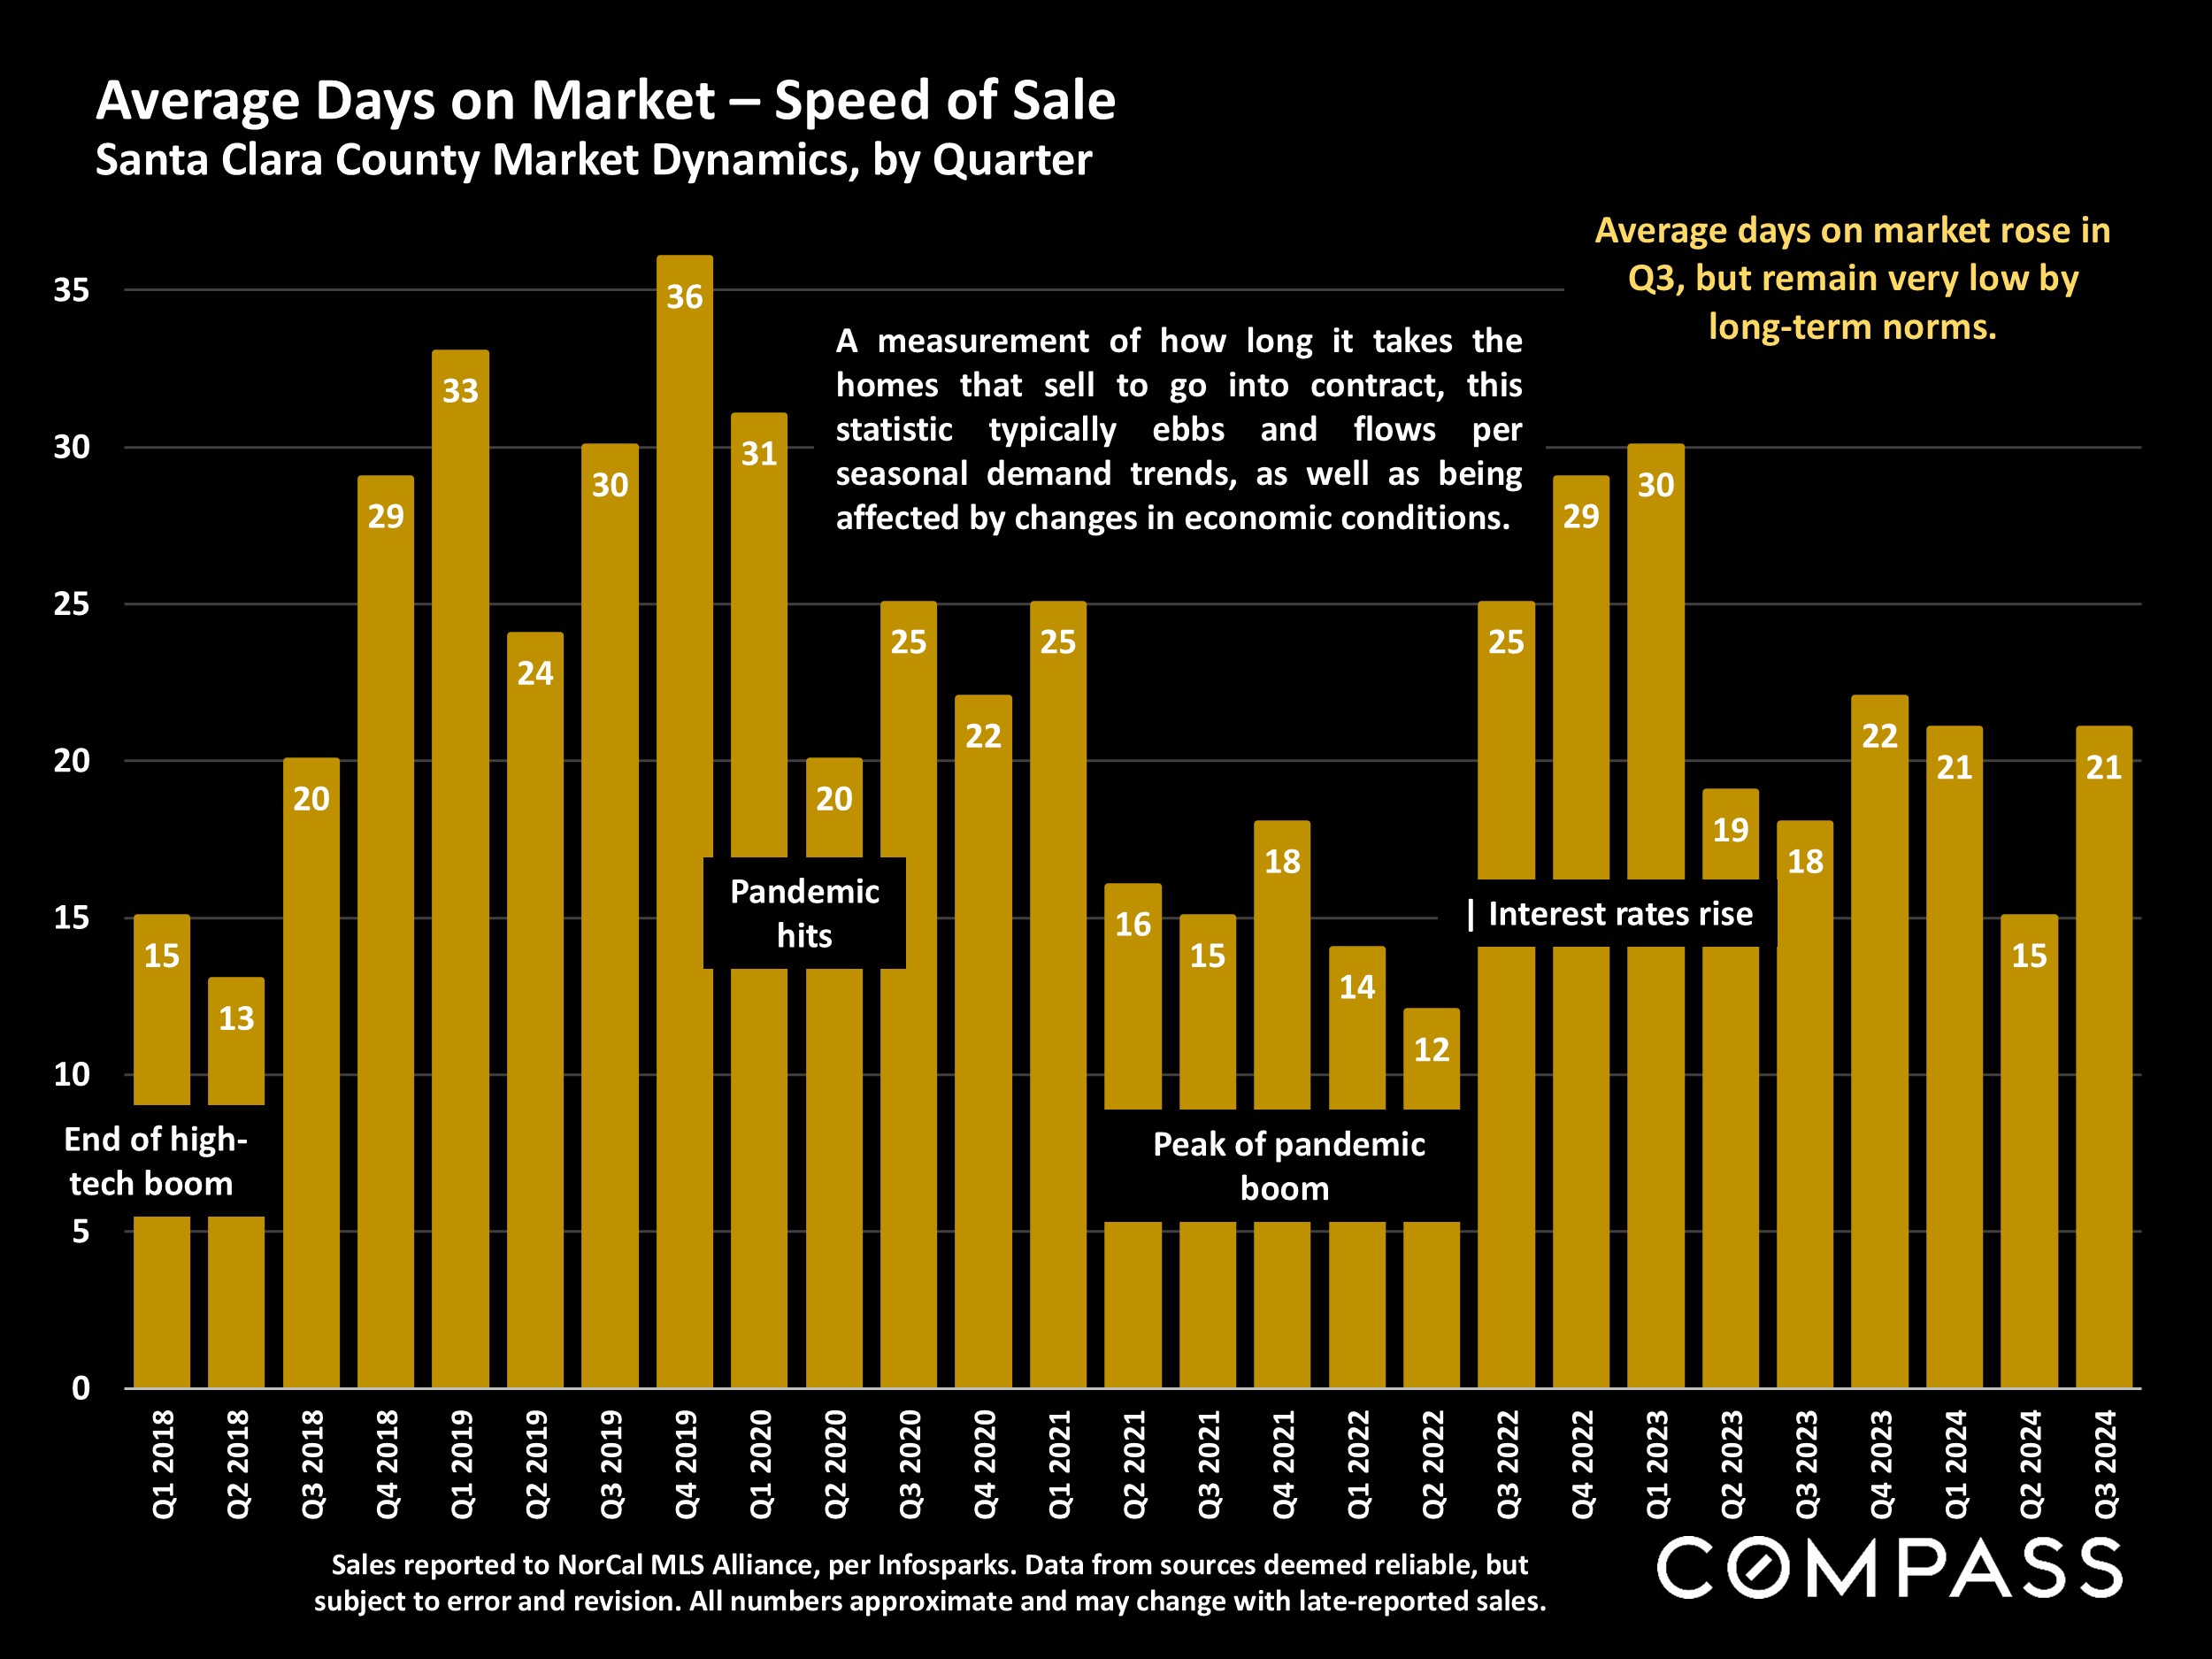
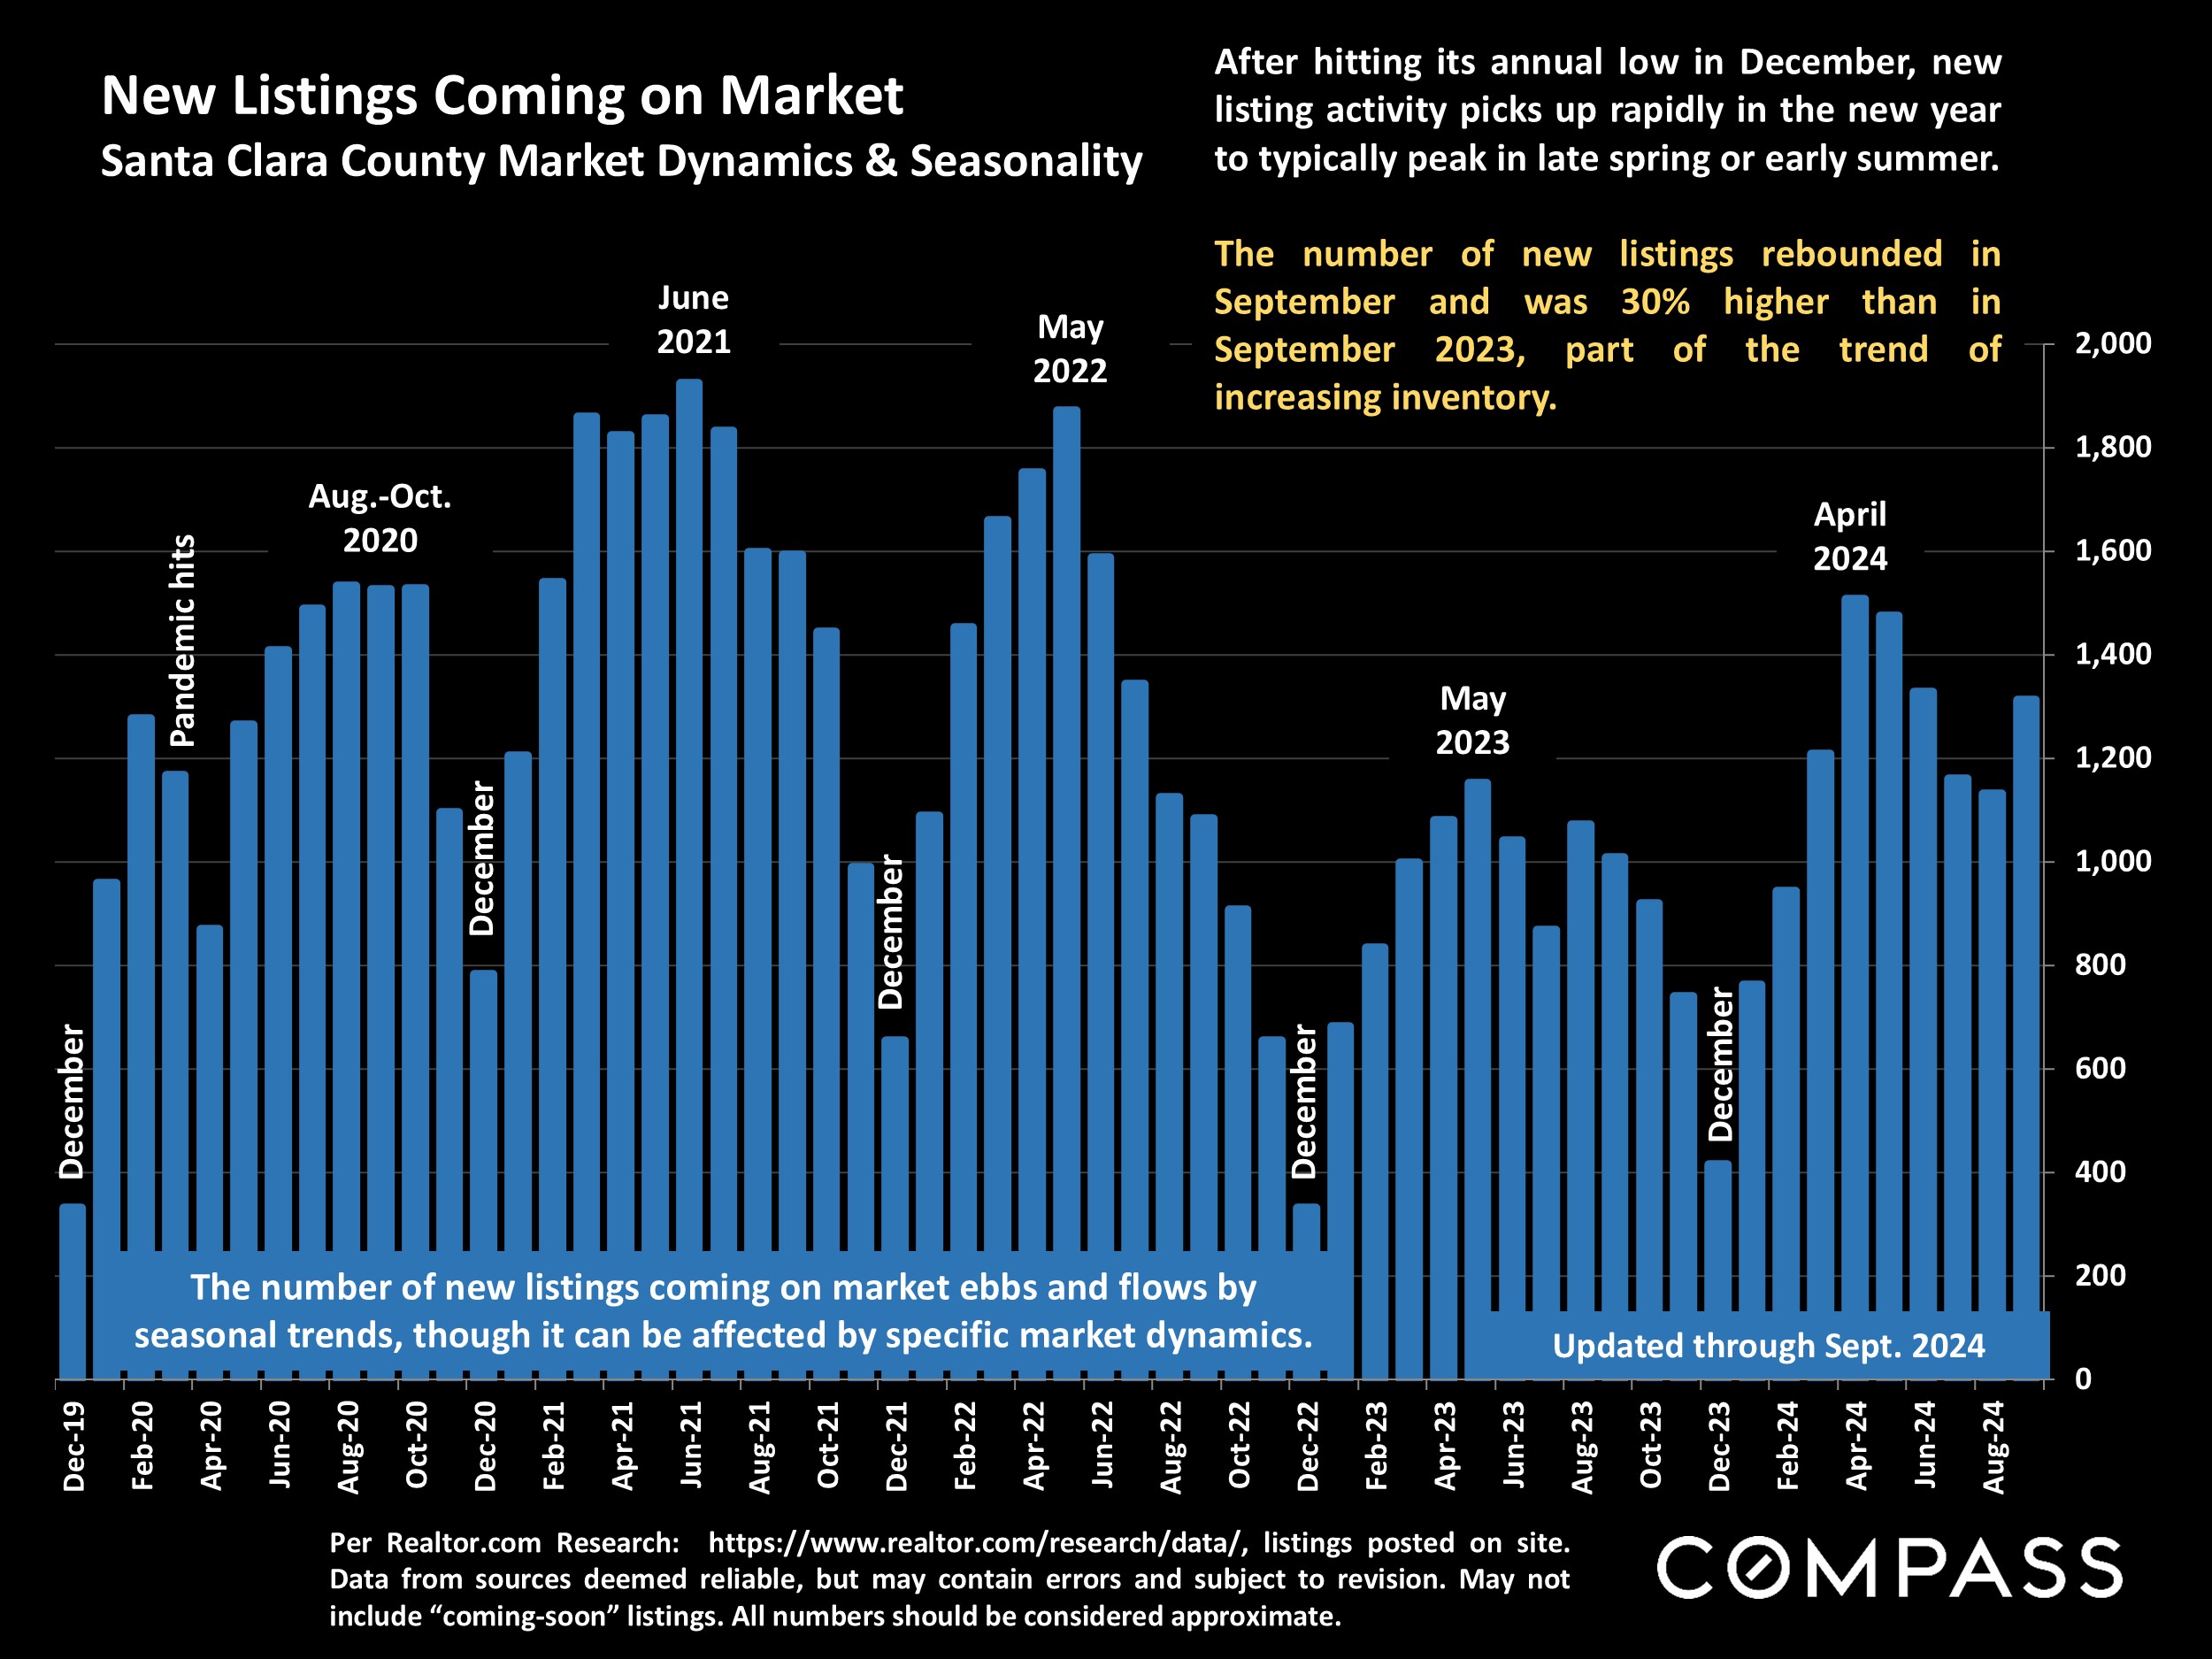
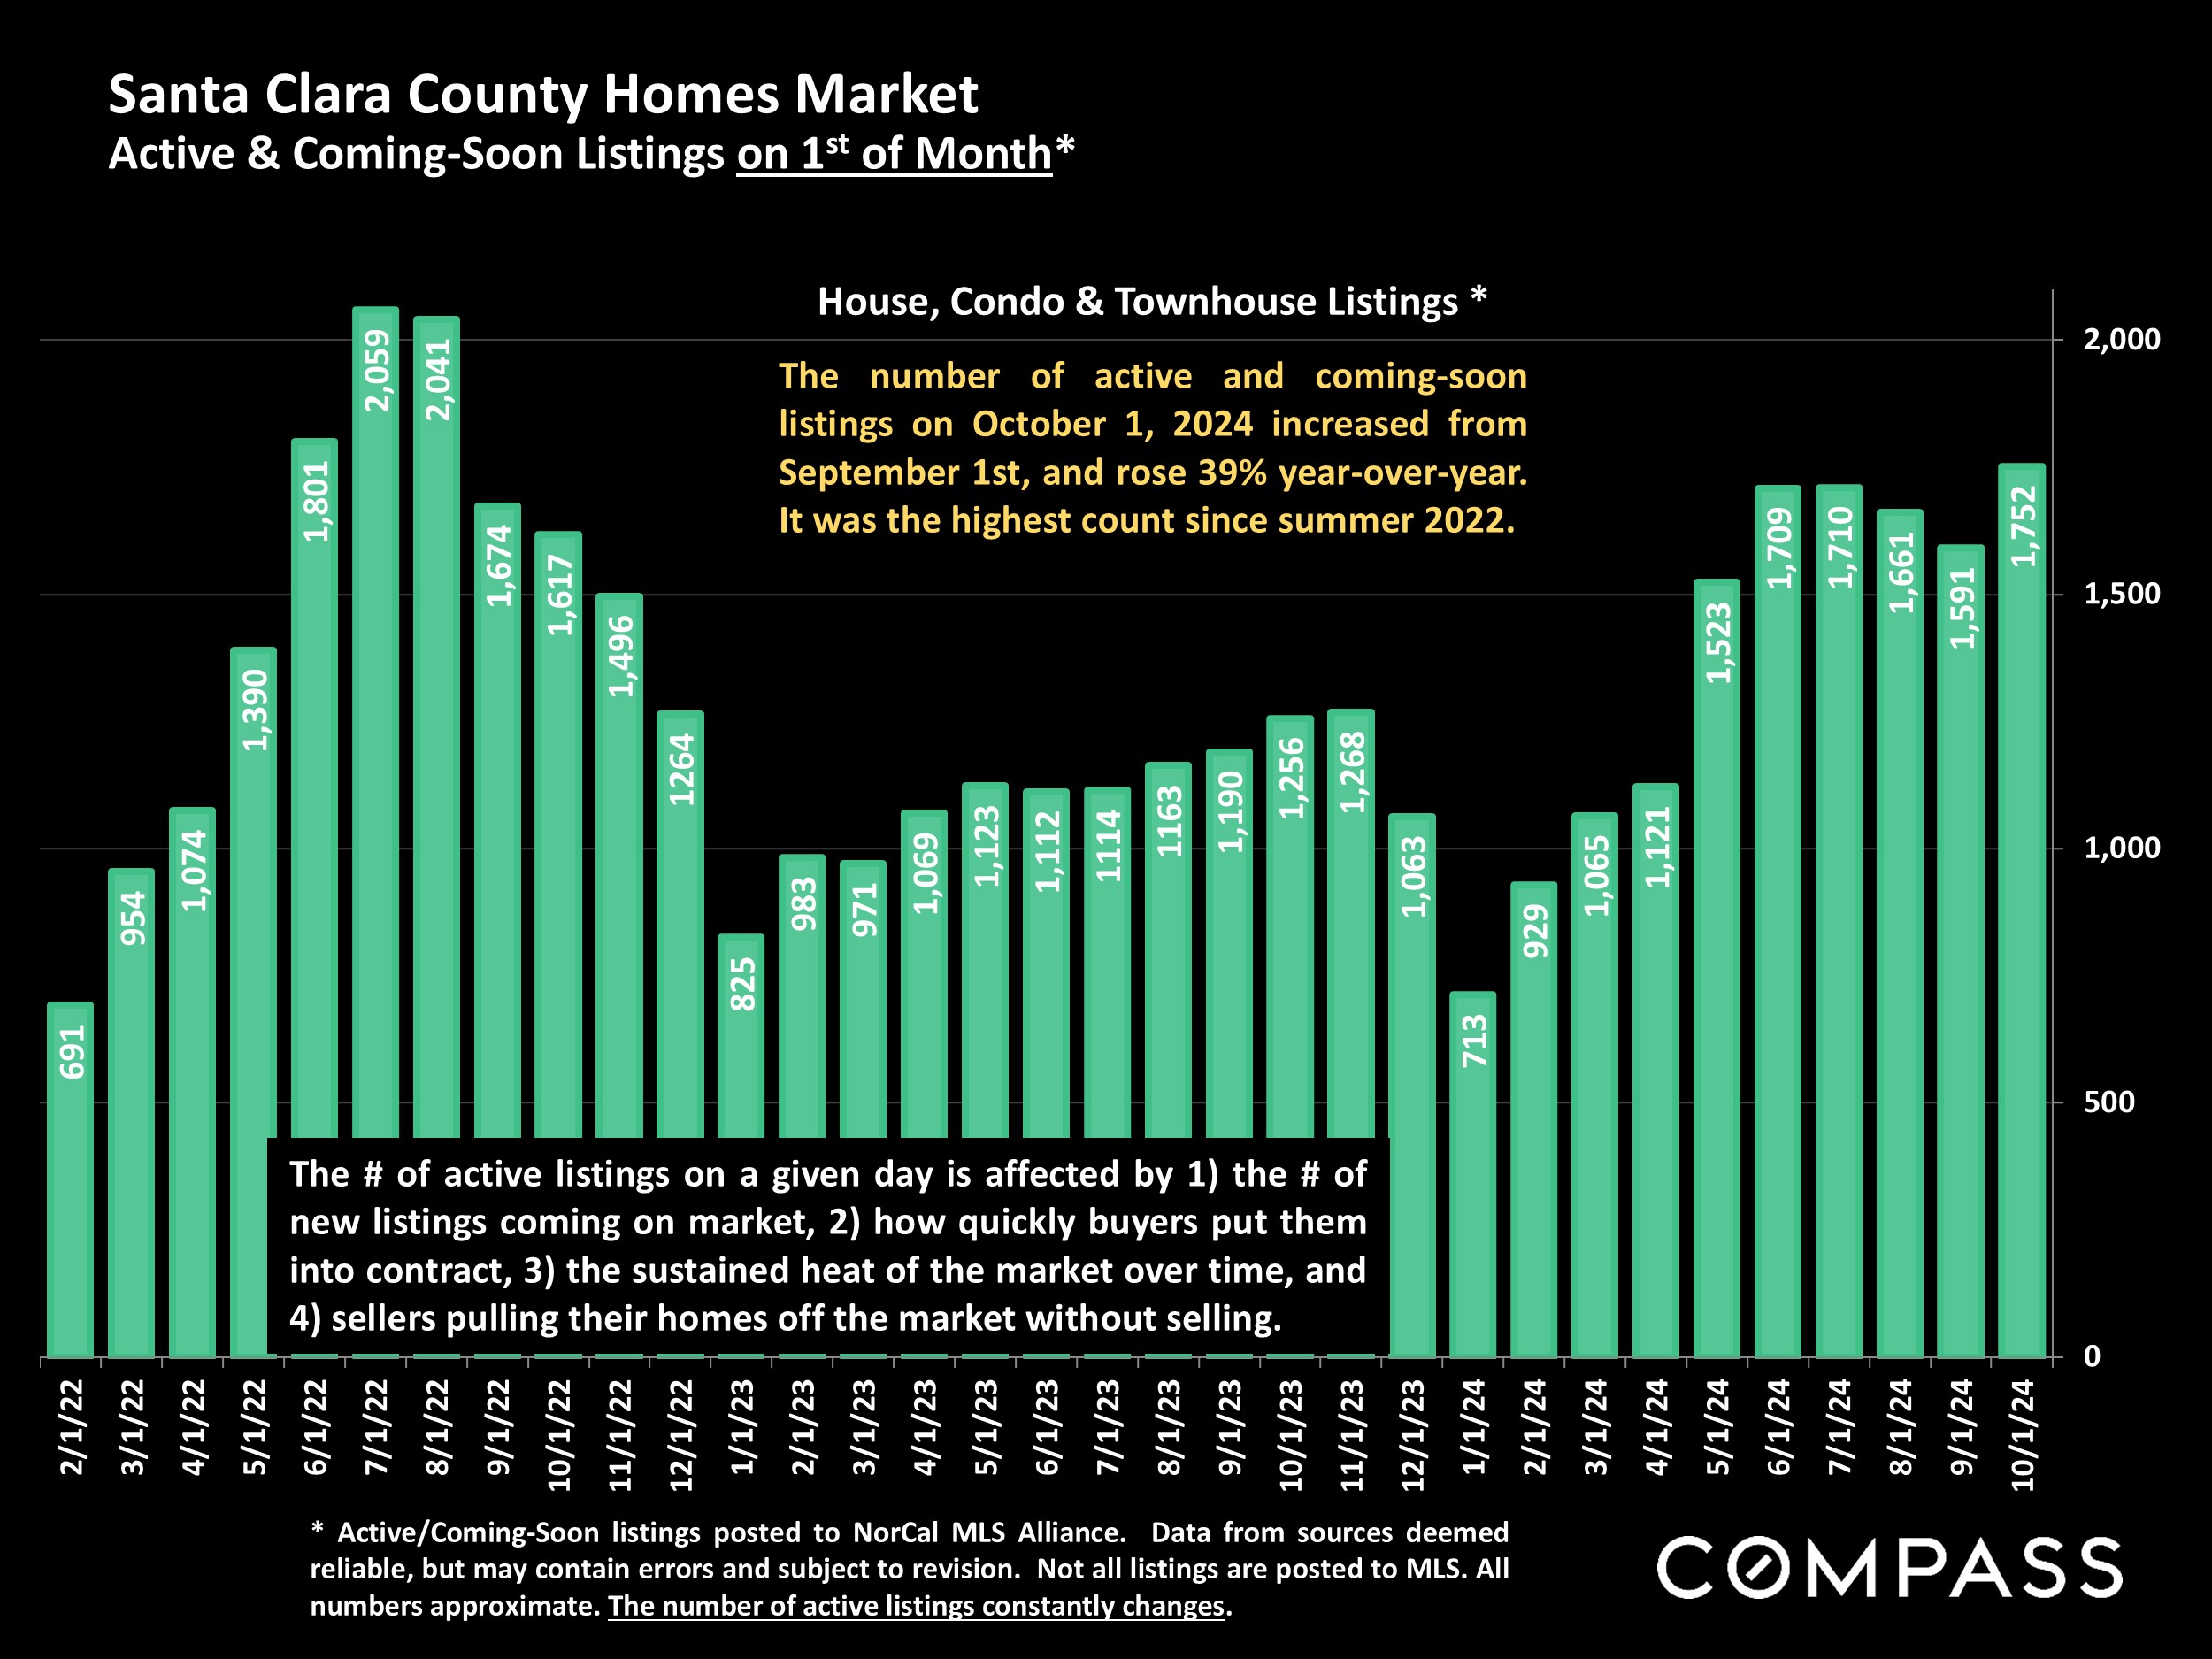
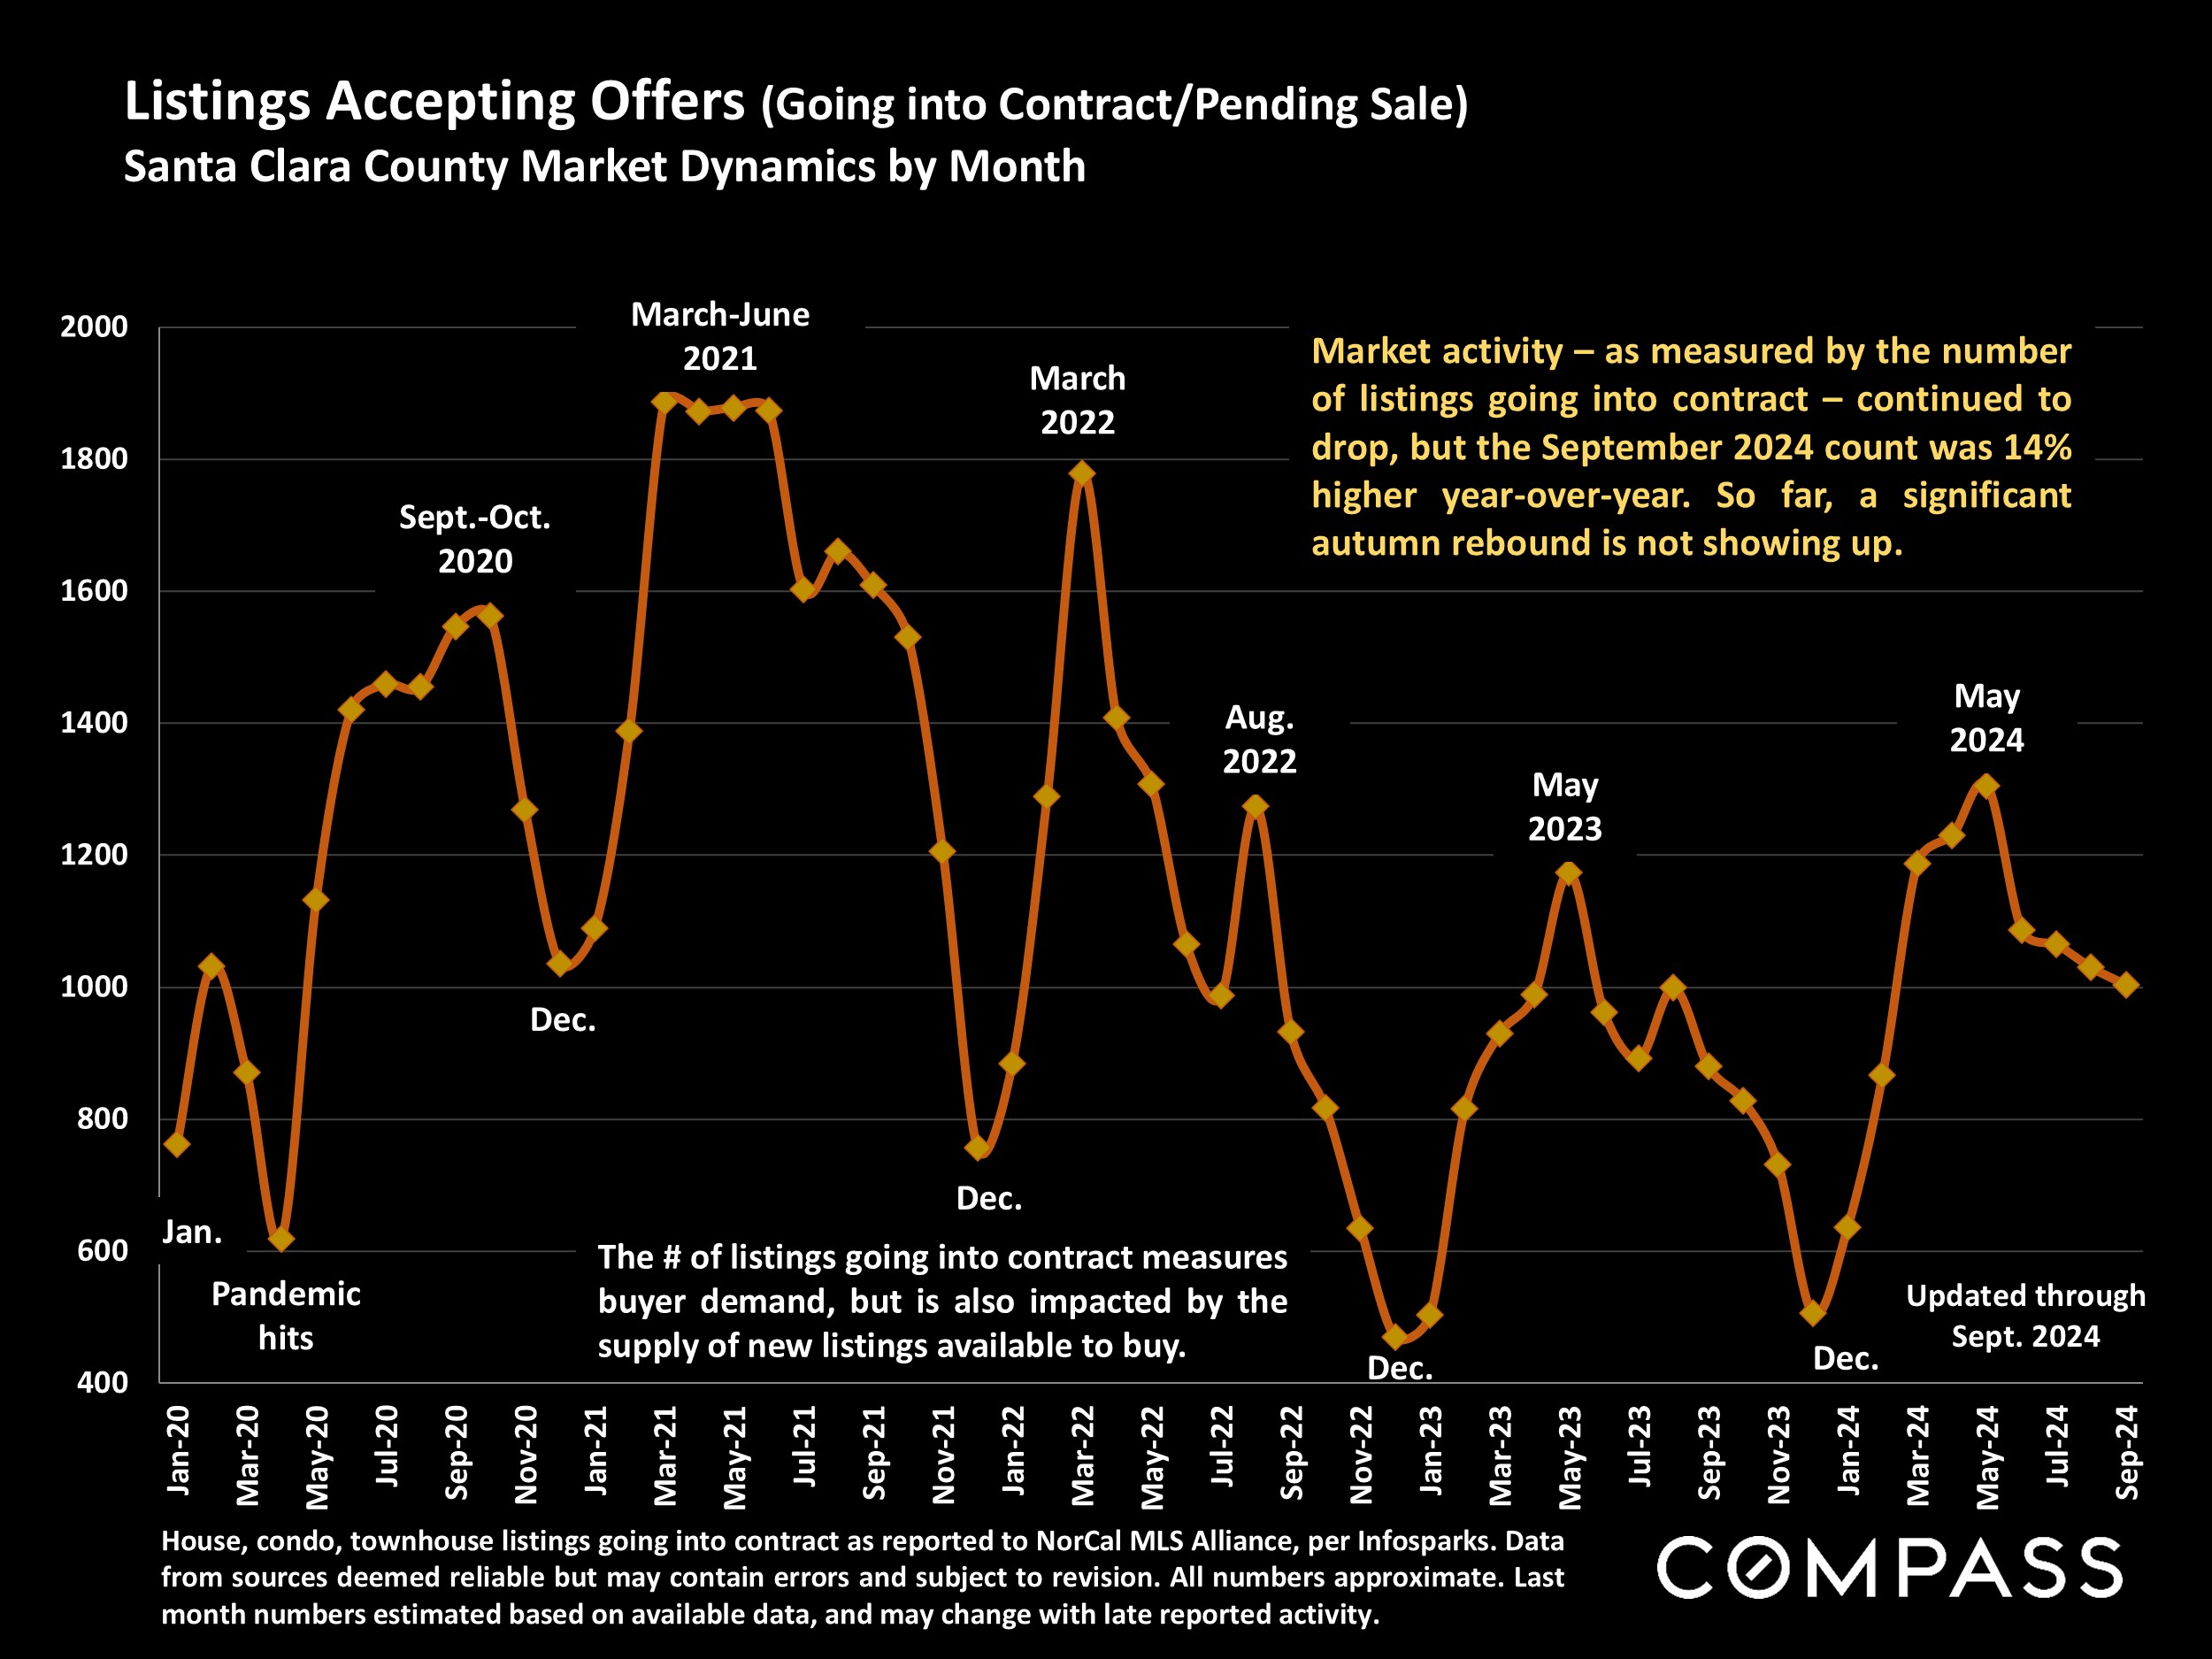
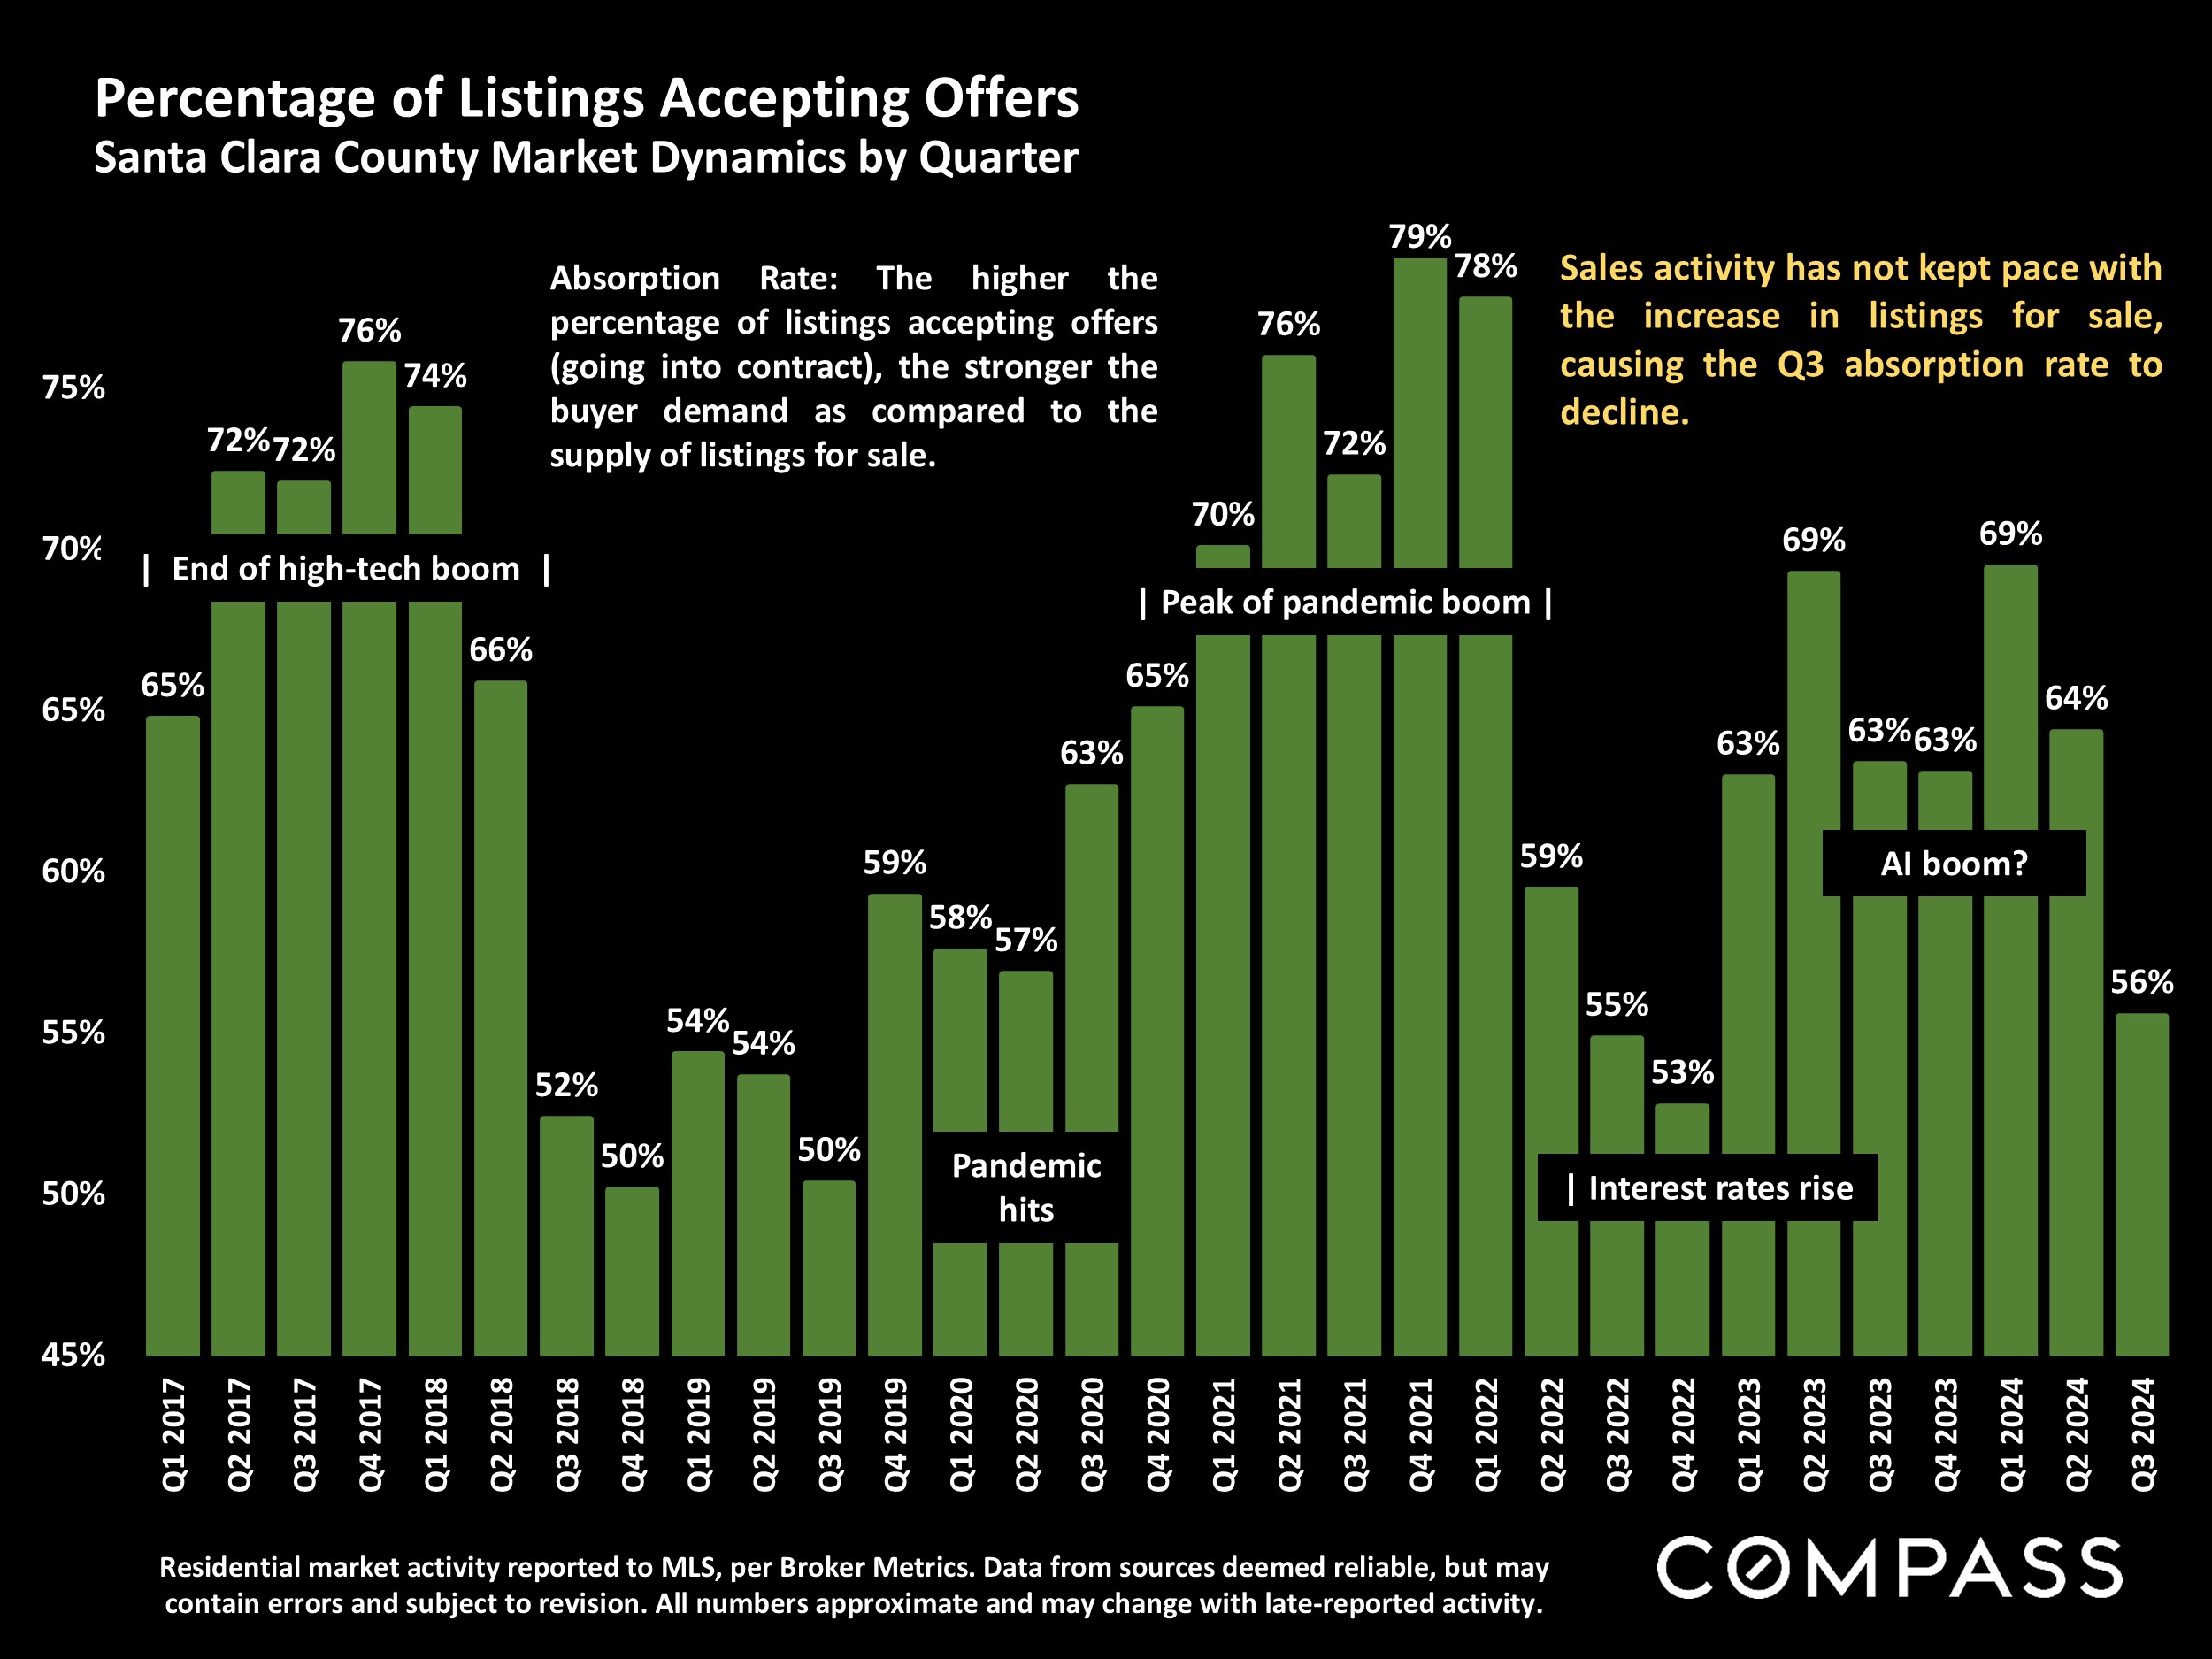
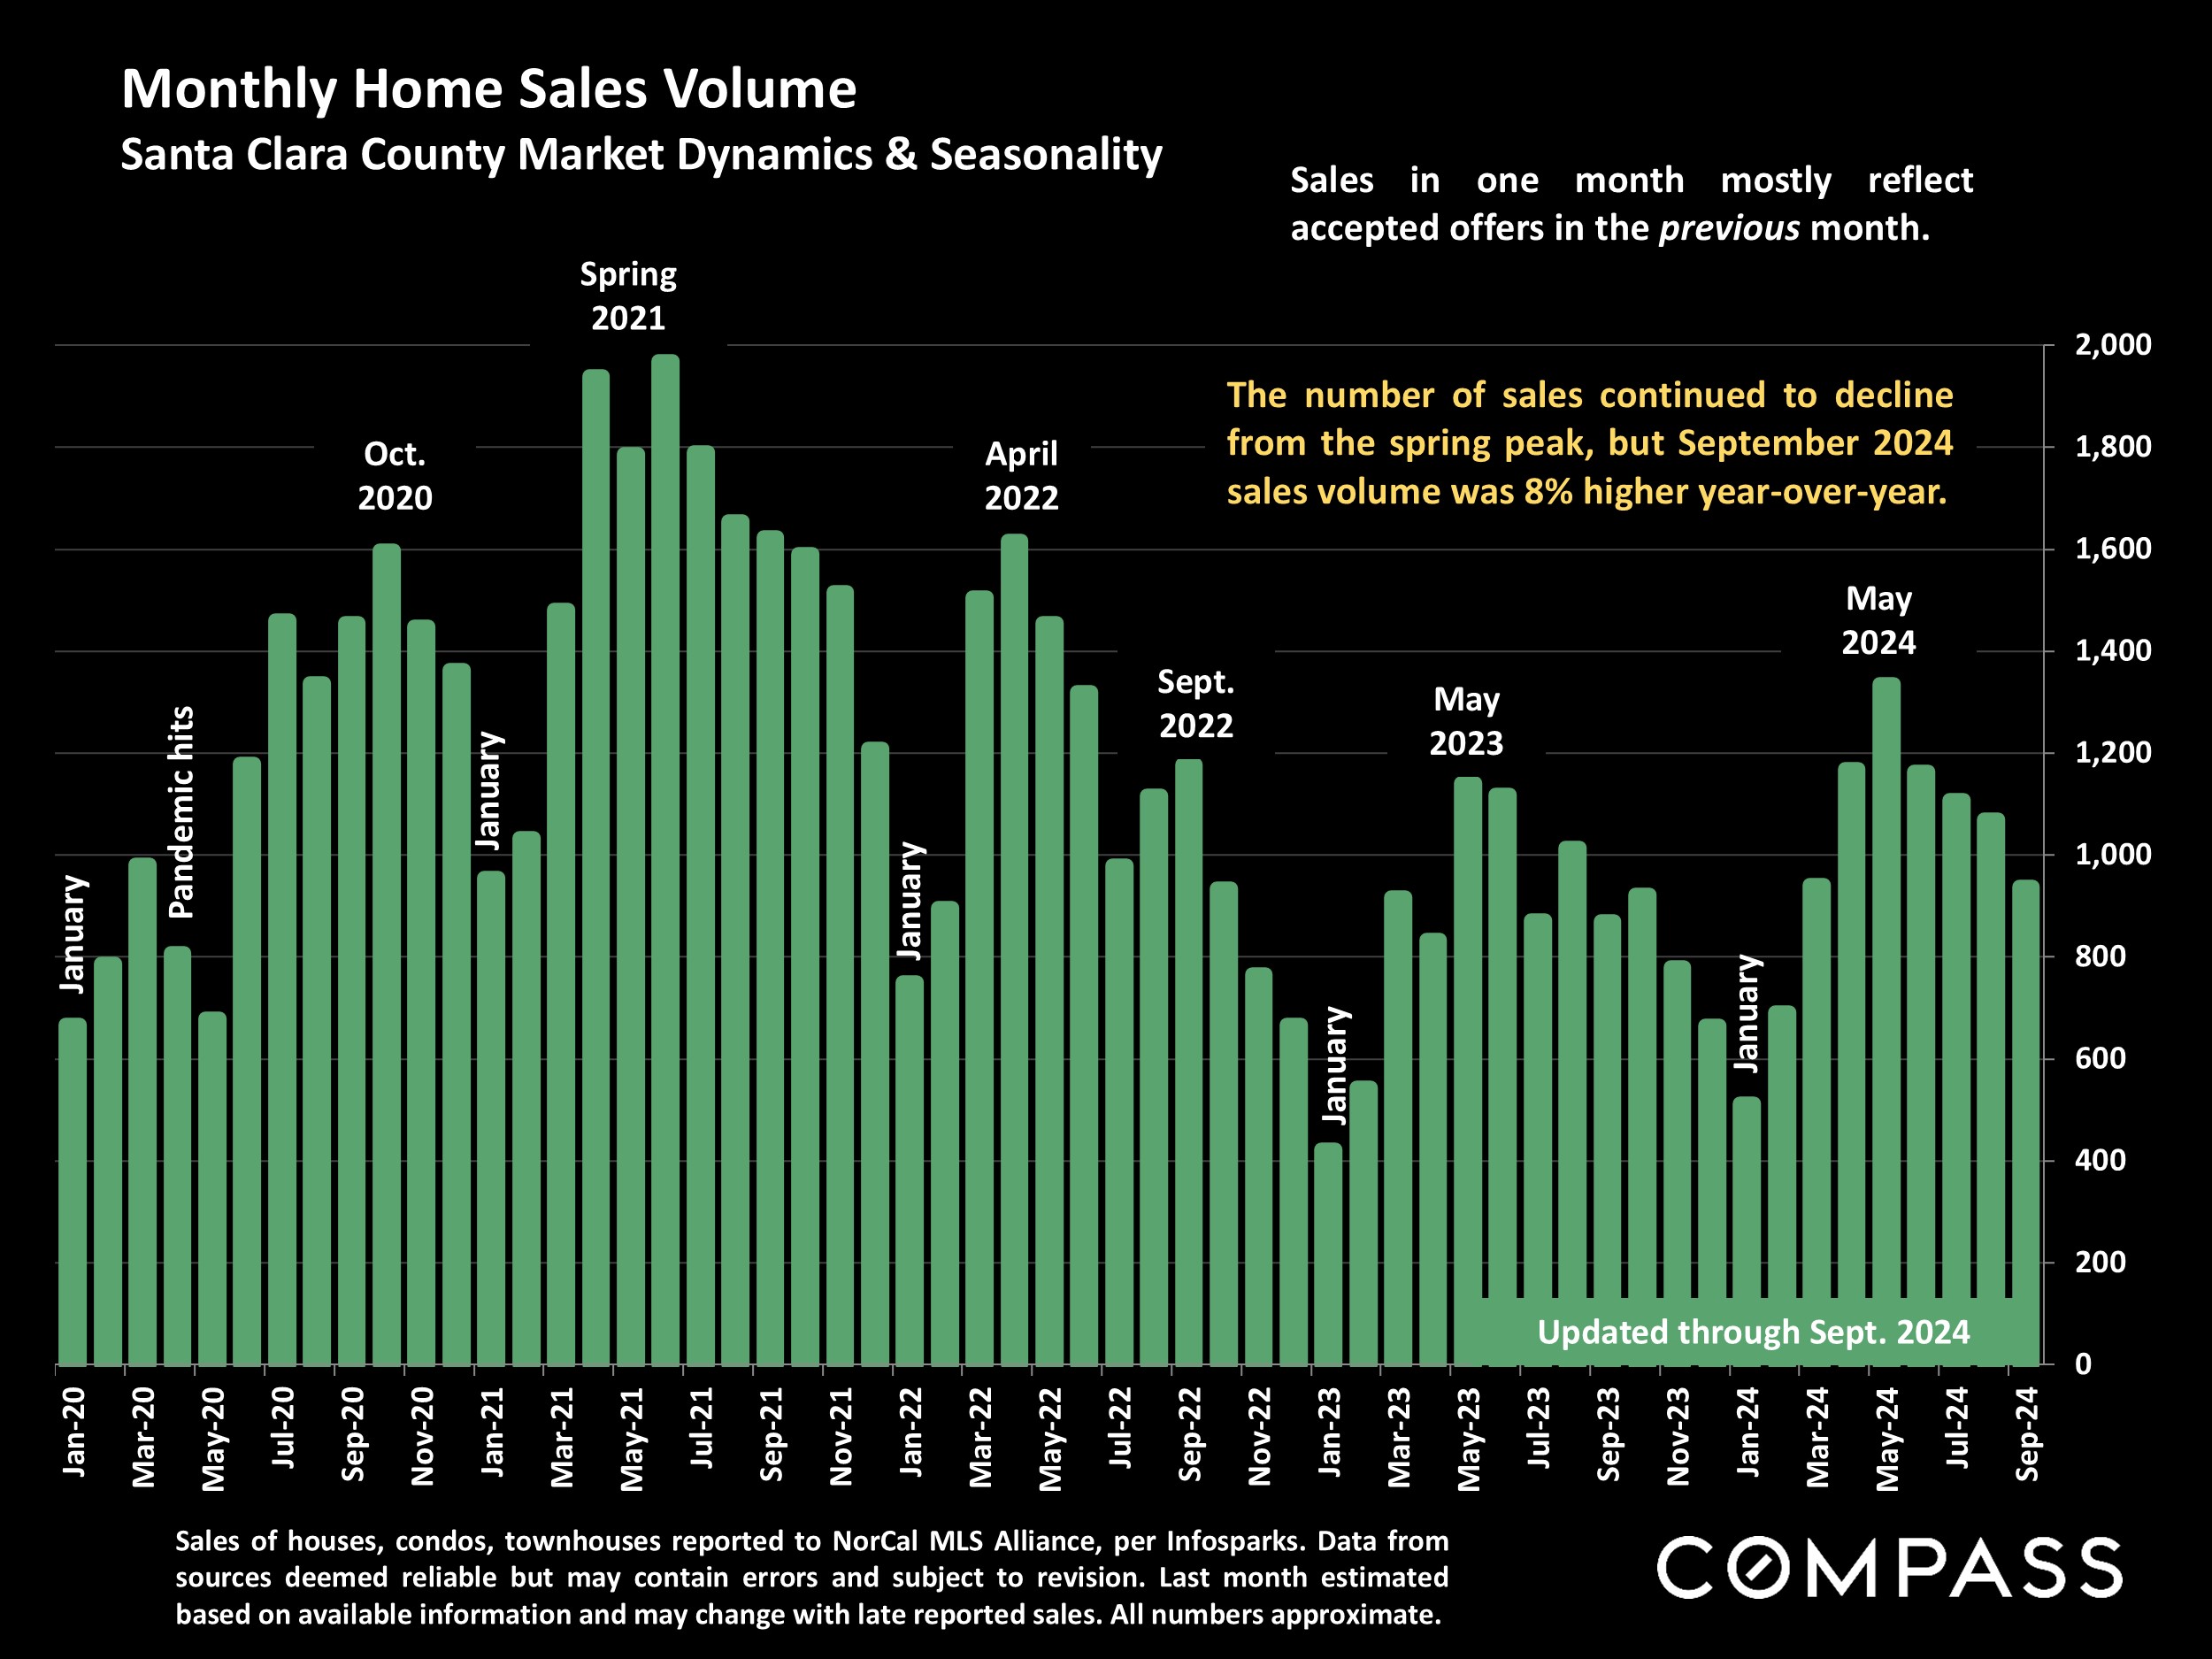
The recent drop in interest rates has not so far precipitated the substantial rebound in buyer demand that many had expected. It may be that expectations of further declines are keeping some buyers on the sidelines as they wait (and hope) for that to occur. In the meantime, the increase in the number of homes for sale continues to outpace sales activity, tilting the supply and demand dynamic and underlying market conditions toward buyers’ advantage. However, many homes are still selling quickly for over asking price: It all depends on the specific property, its price, location, condition and circumstances. Market-heat indicators (and median sales prices) usually peak in spring (Q2), then cool significantly in Q3, and that was broadly the case this year.
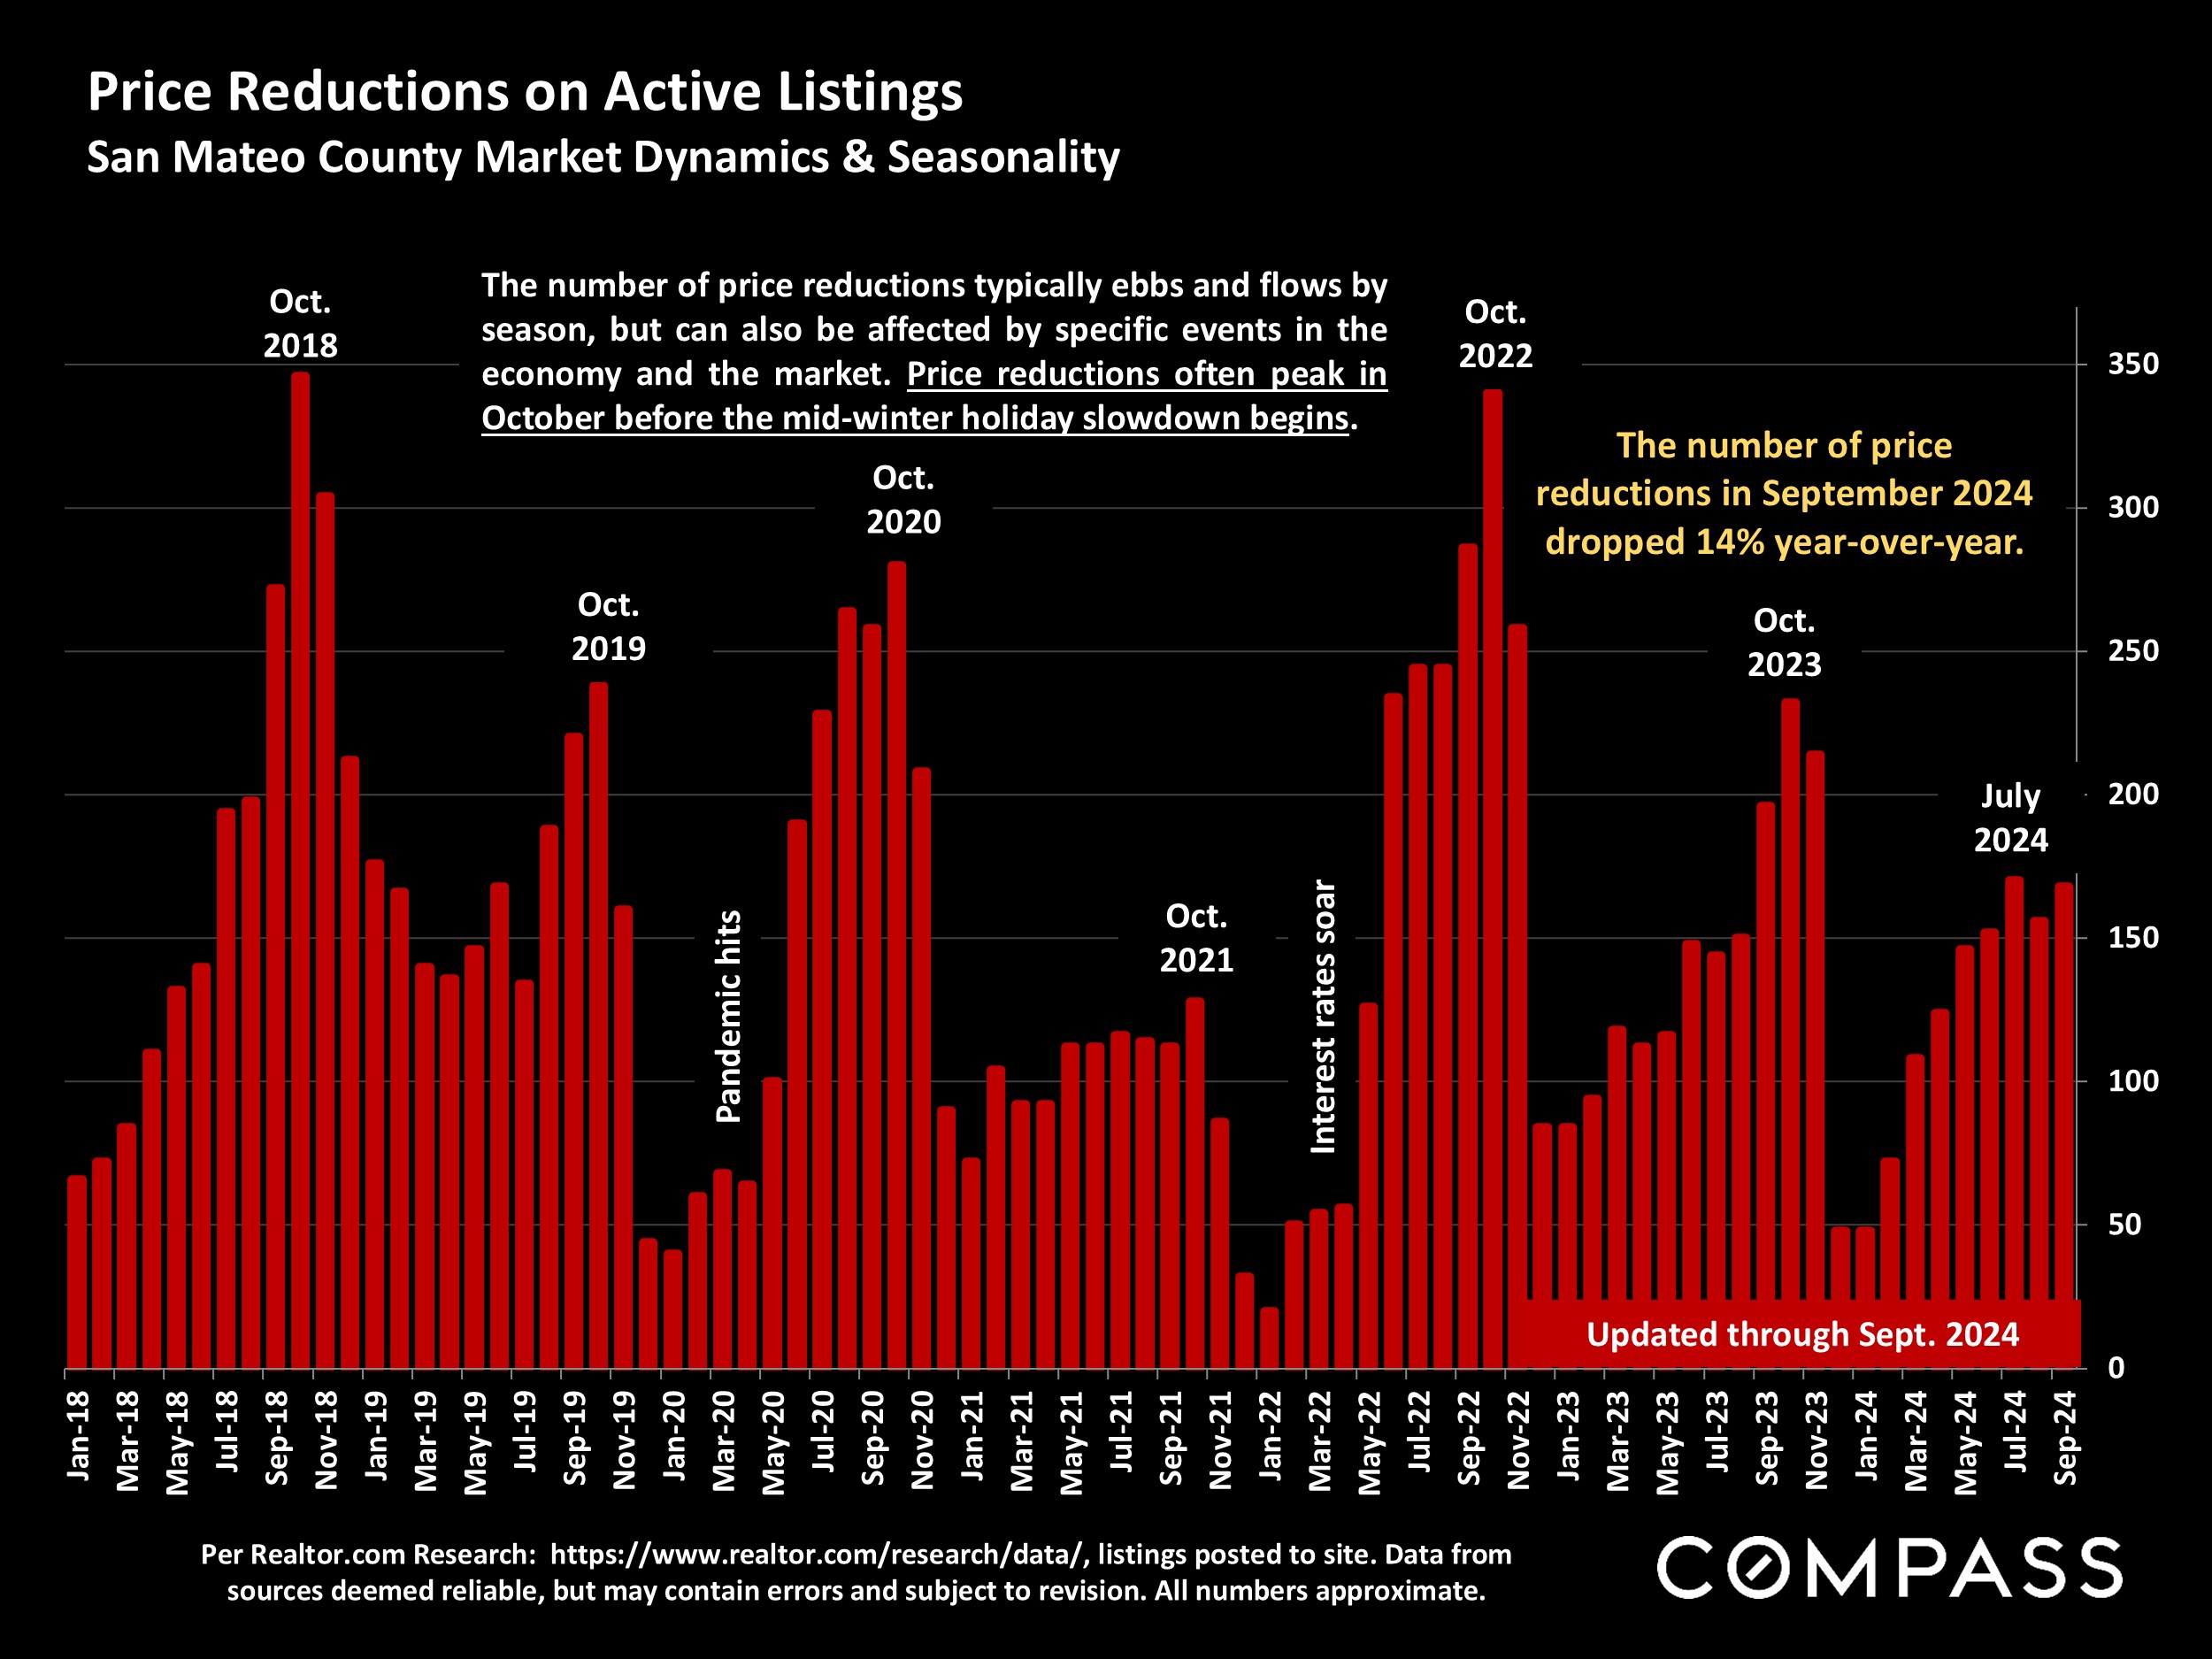
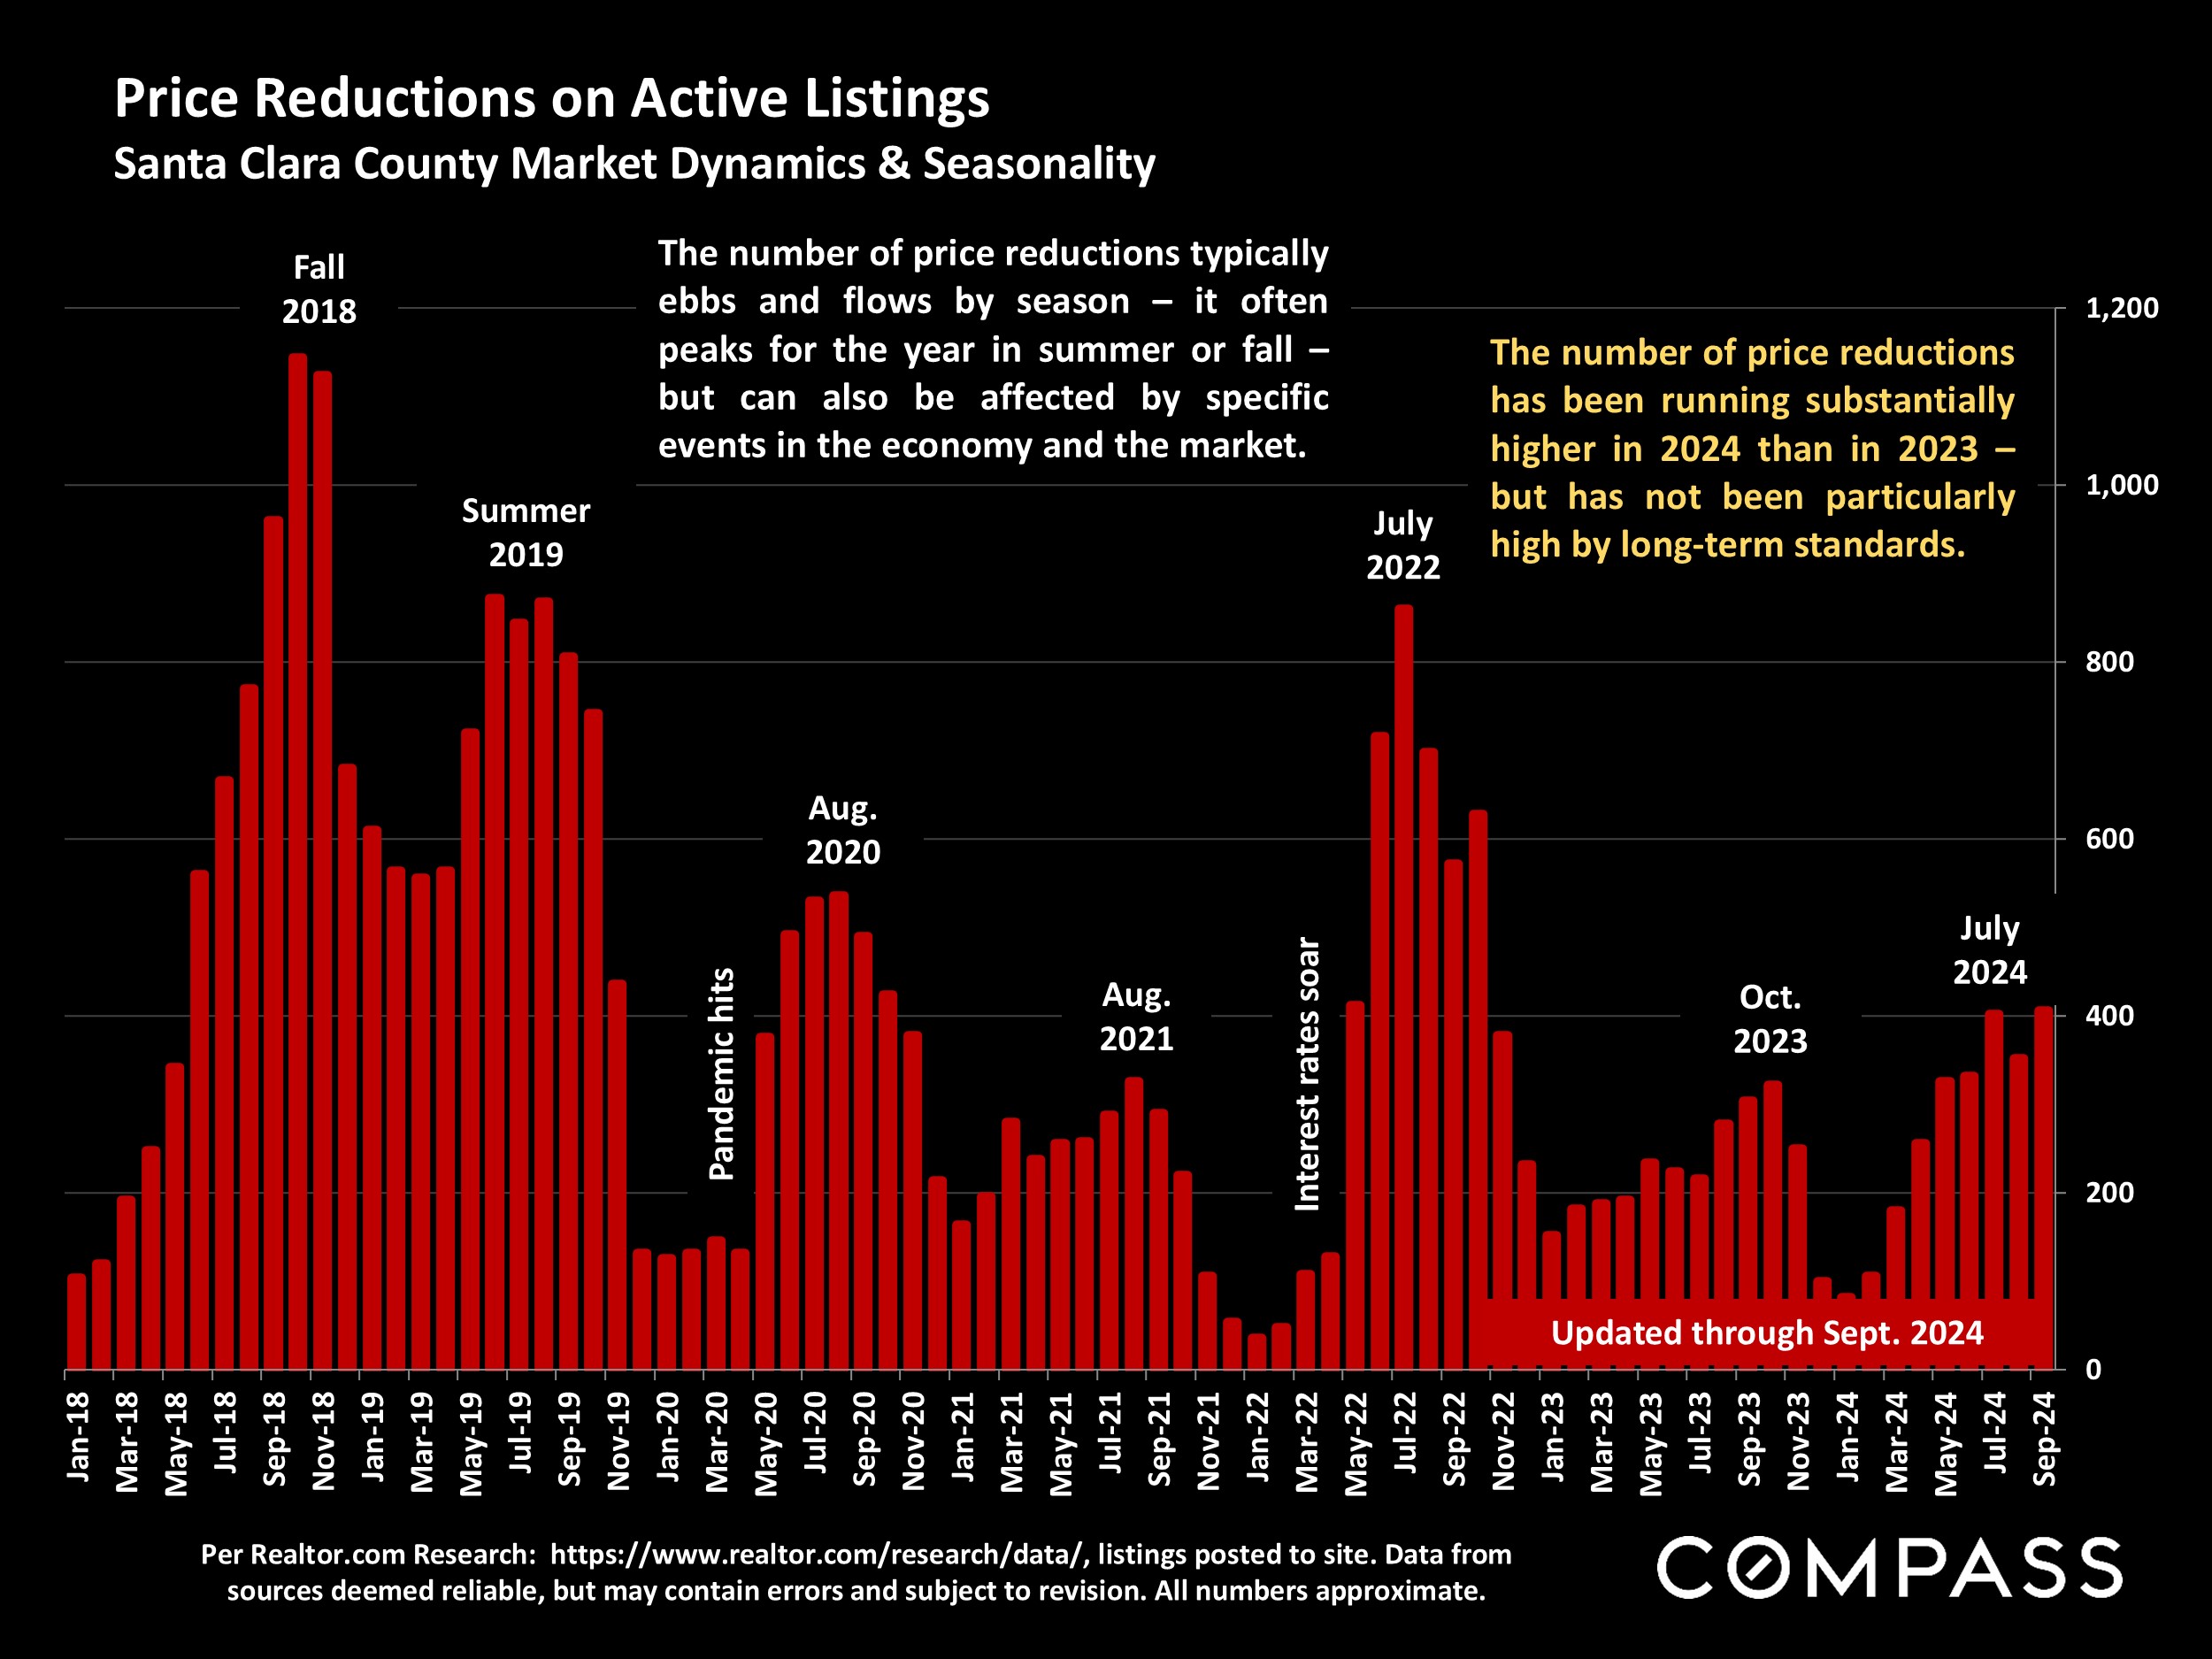
October is the heart of the autumn selling season before activity typically begins to plunge heading into the mid-winter holidays. It is also a period that can see a high number of price reductions as sellers attempt to get unsold homes into escrow before that big slowdown occurs.


Statistics are generalities, essentially summaries of widely disparate data generated by dozens, hundreds or thousands of unique, individual sales occurring within different time periods. They are best seen not as precise measurements, but as broad, comparative indicators, with reasonable margins of error. Anomalous fluctuations in statistics are not uncommon, especially in smaller, expensive market segments. Last period data should be considered estimates that may change with late-reported data. Different analytics programs sometimes define statistics – such as “active listings,” “days on market,” and “months supply of inventory” – differently: what is most meaningful are not specific calculations but the trends they illustrate. Most listing and sales data derives from the local or regional multi-listing service (MLS) of the area specified in the analysis, but not all listings or sales are reported to MLS and these won’t be reflected in the data. “Homes” signifies real-property, single-household housing units: houses, condos, co-ops, townhouses, duets and TICs (but not mobile homes), as applicable to each market. City/town names refer specifically to the named cities and towns, unless otherwise delineated. Multi-county metro areas will be specified as such. Data from sources deemed reliable, but may contain errors and subject to revision. All numbers to be considered approximate.
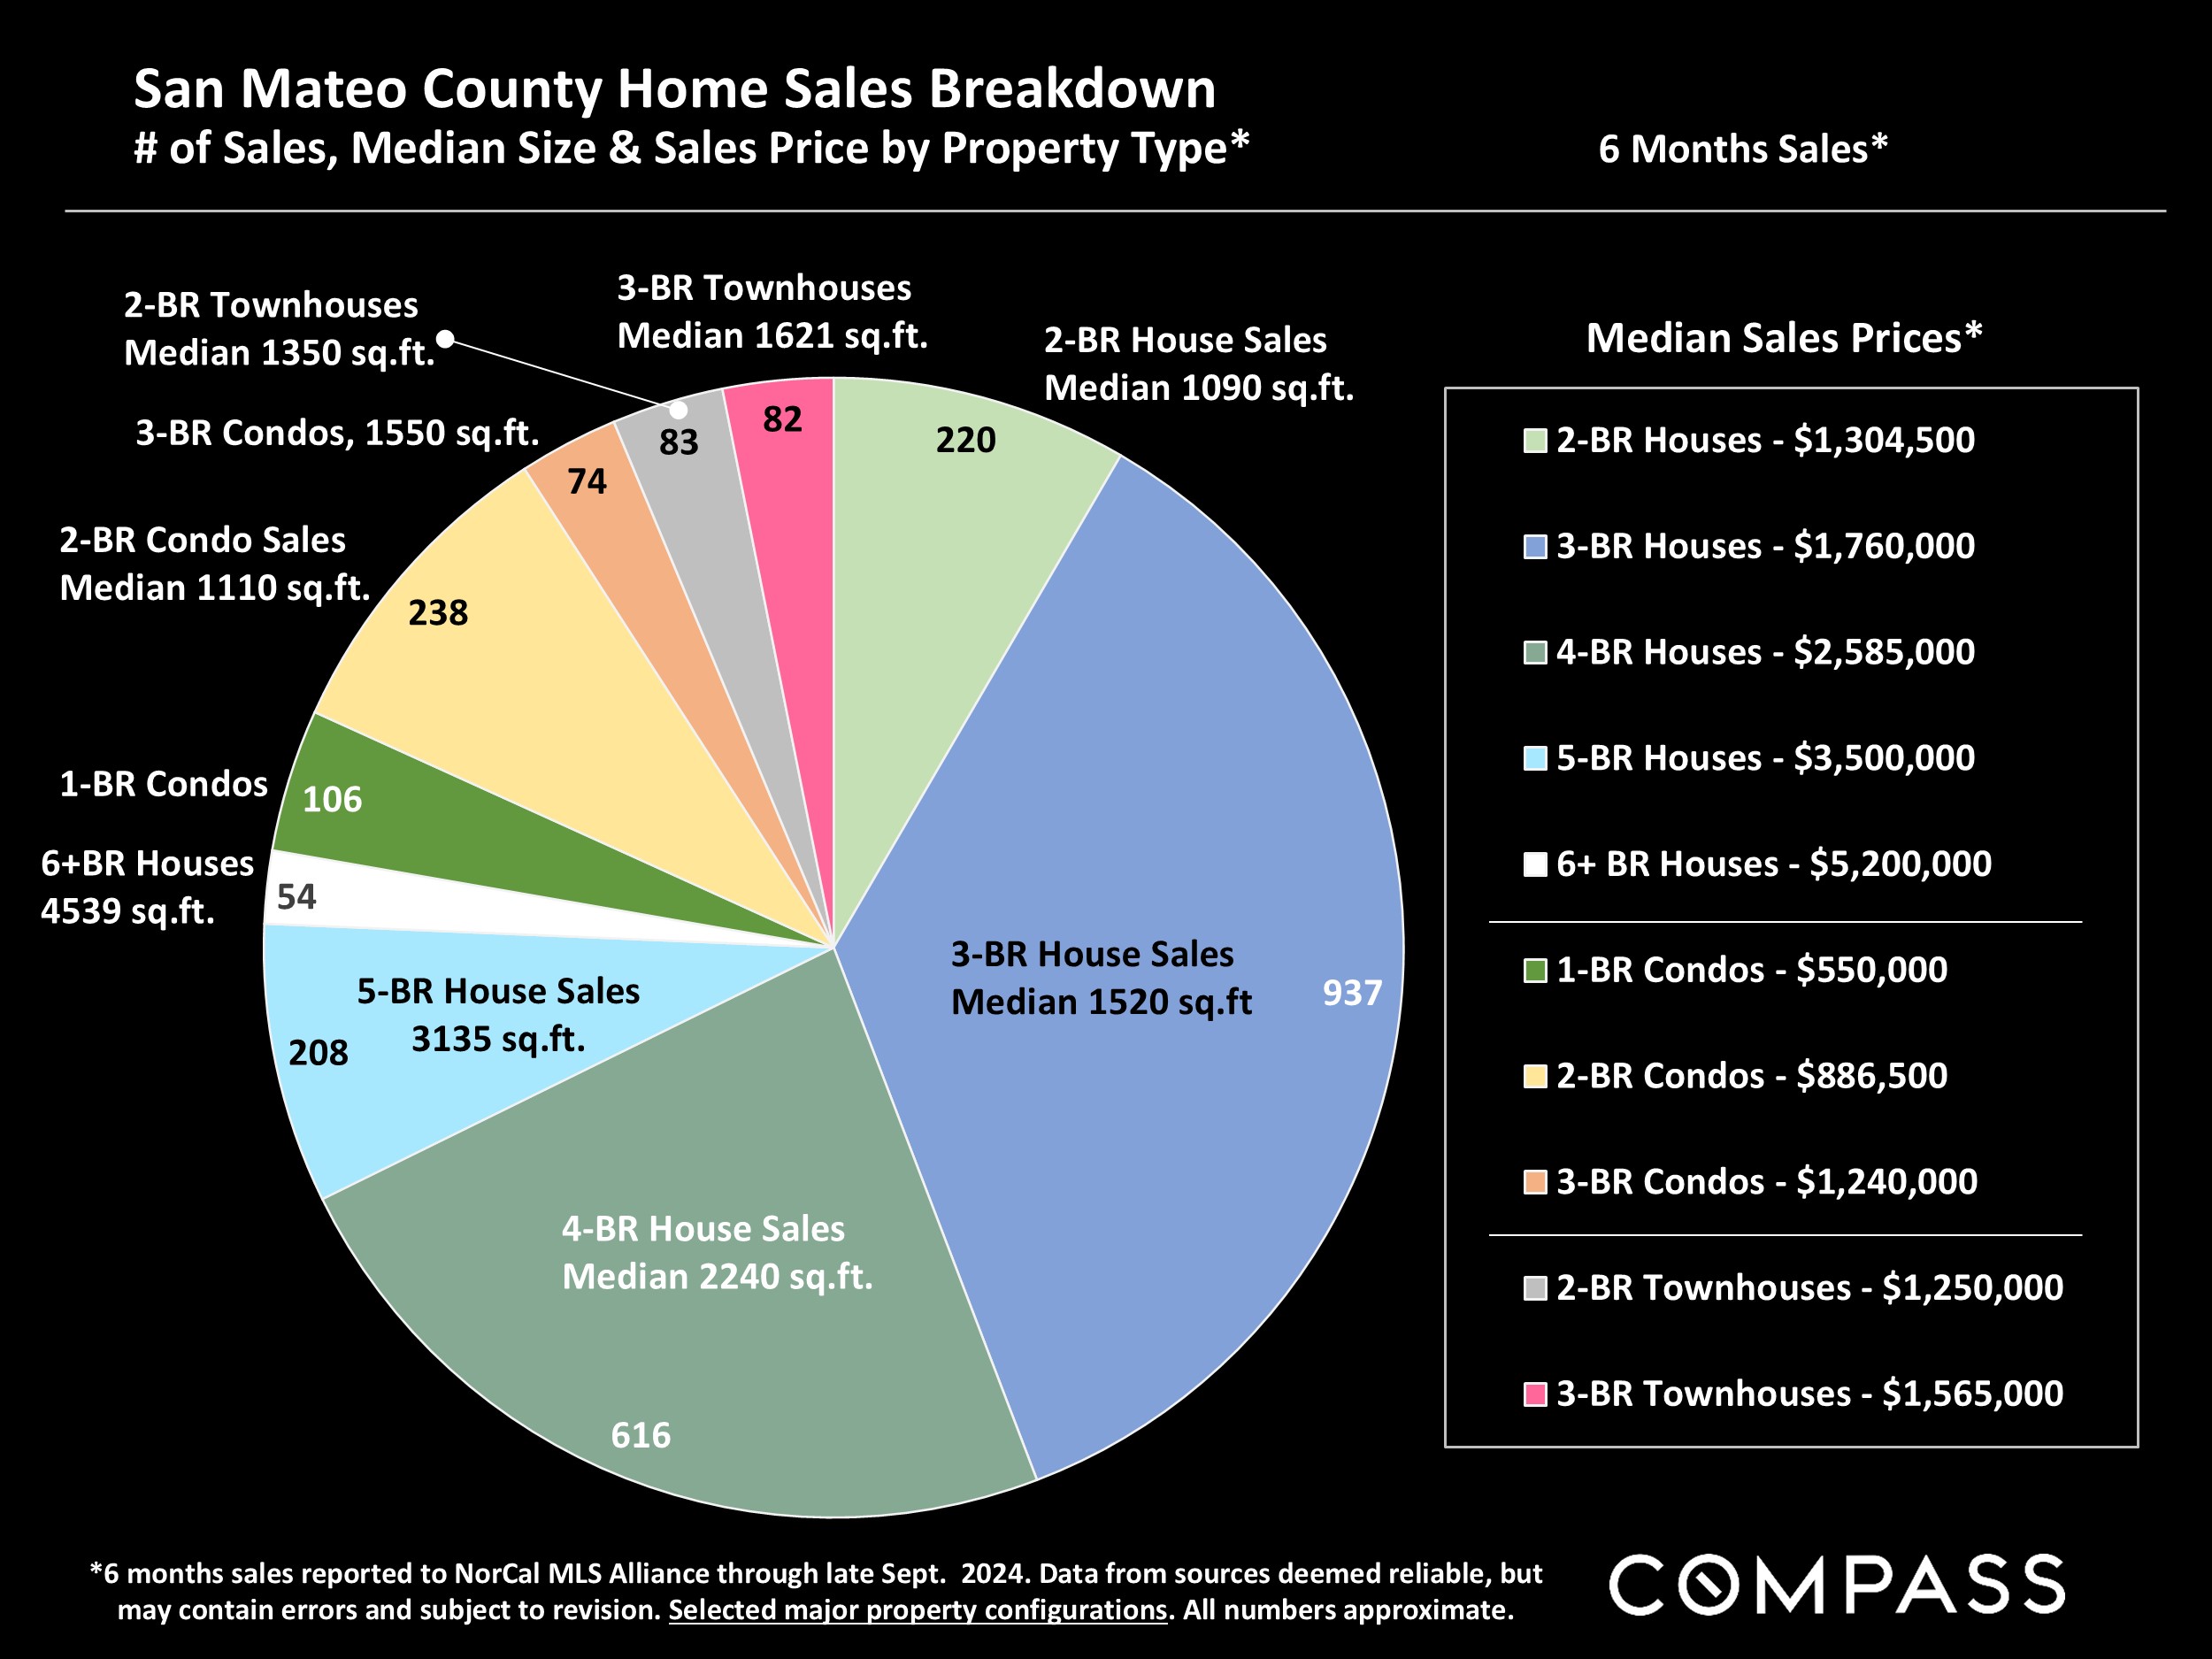
Many aspects of value cannot be adequately reflected in median and average statistics: curb appeal, age, condition, amenities, views, lot size, quality of outdoor space, “bonus” rooms, additional parking, quality of location within the neighborhood, and so on. How any of these statistics apply to any particular home is unknown without a specific comparative market analysis.
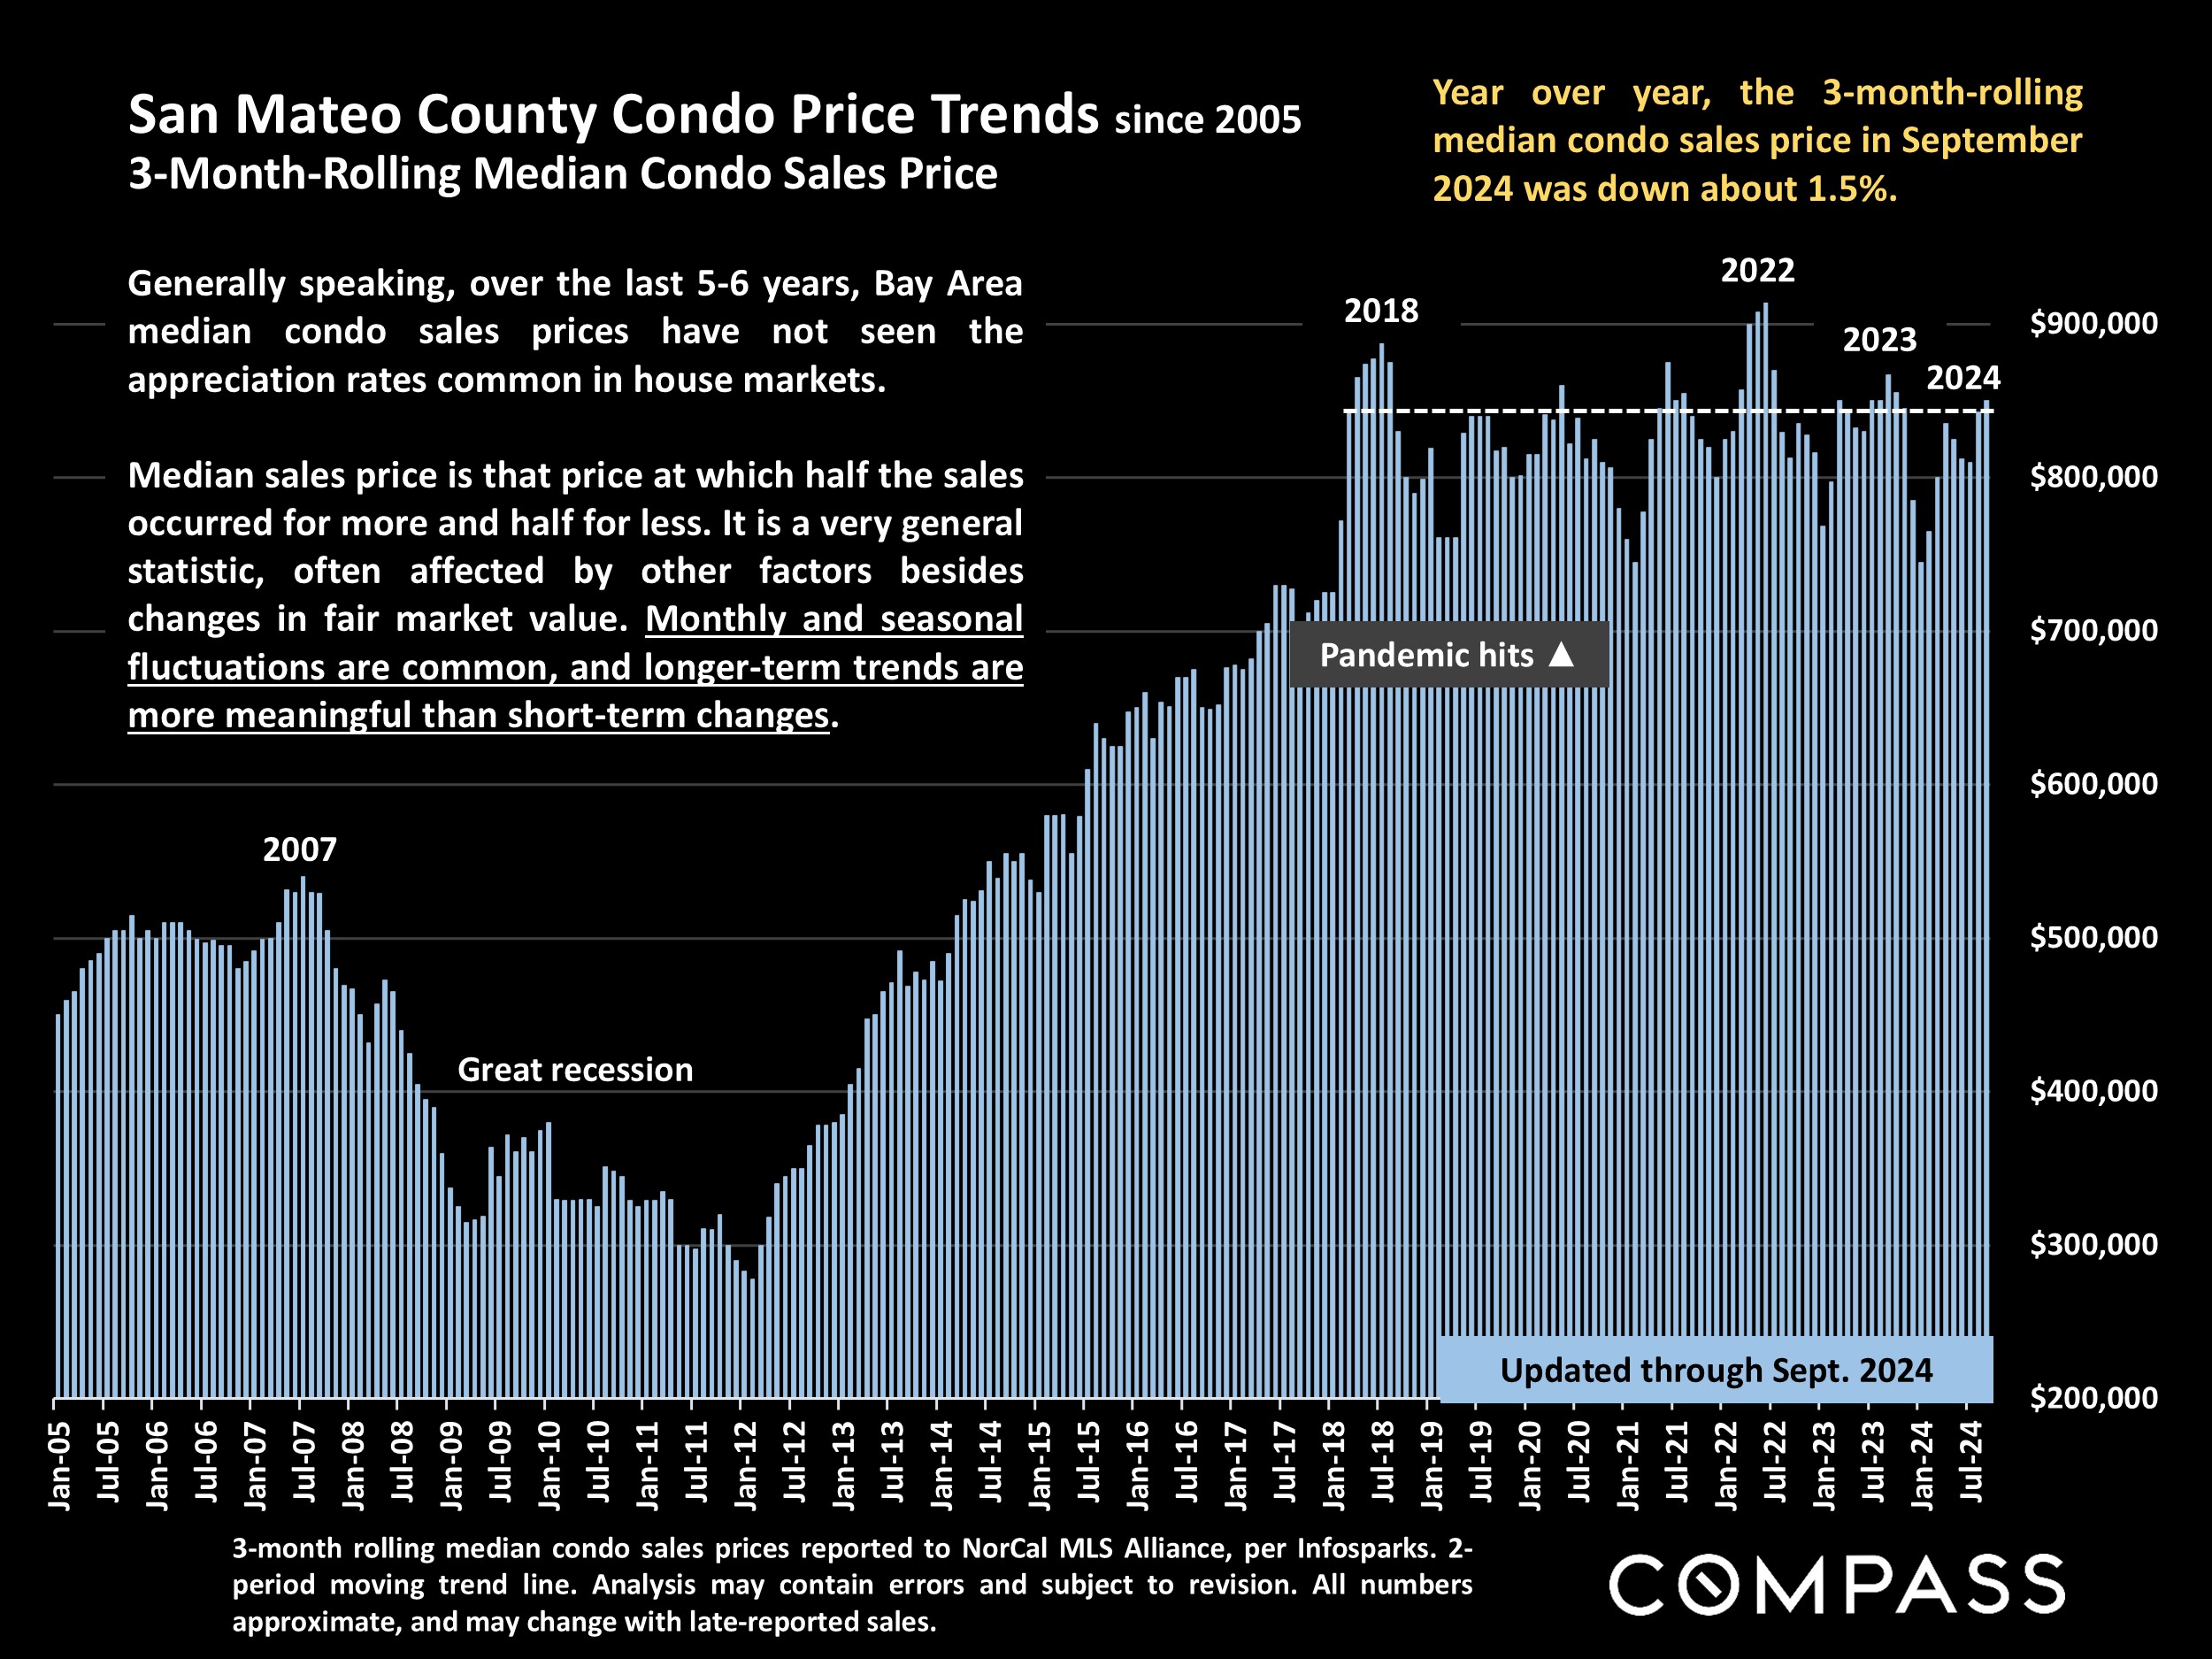
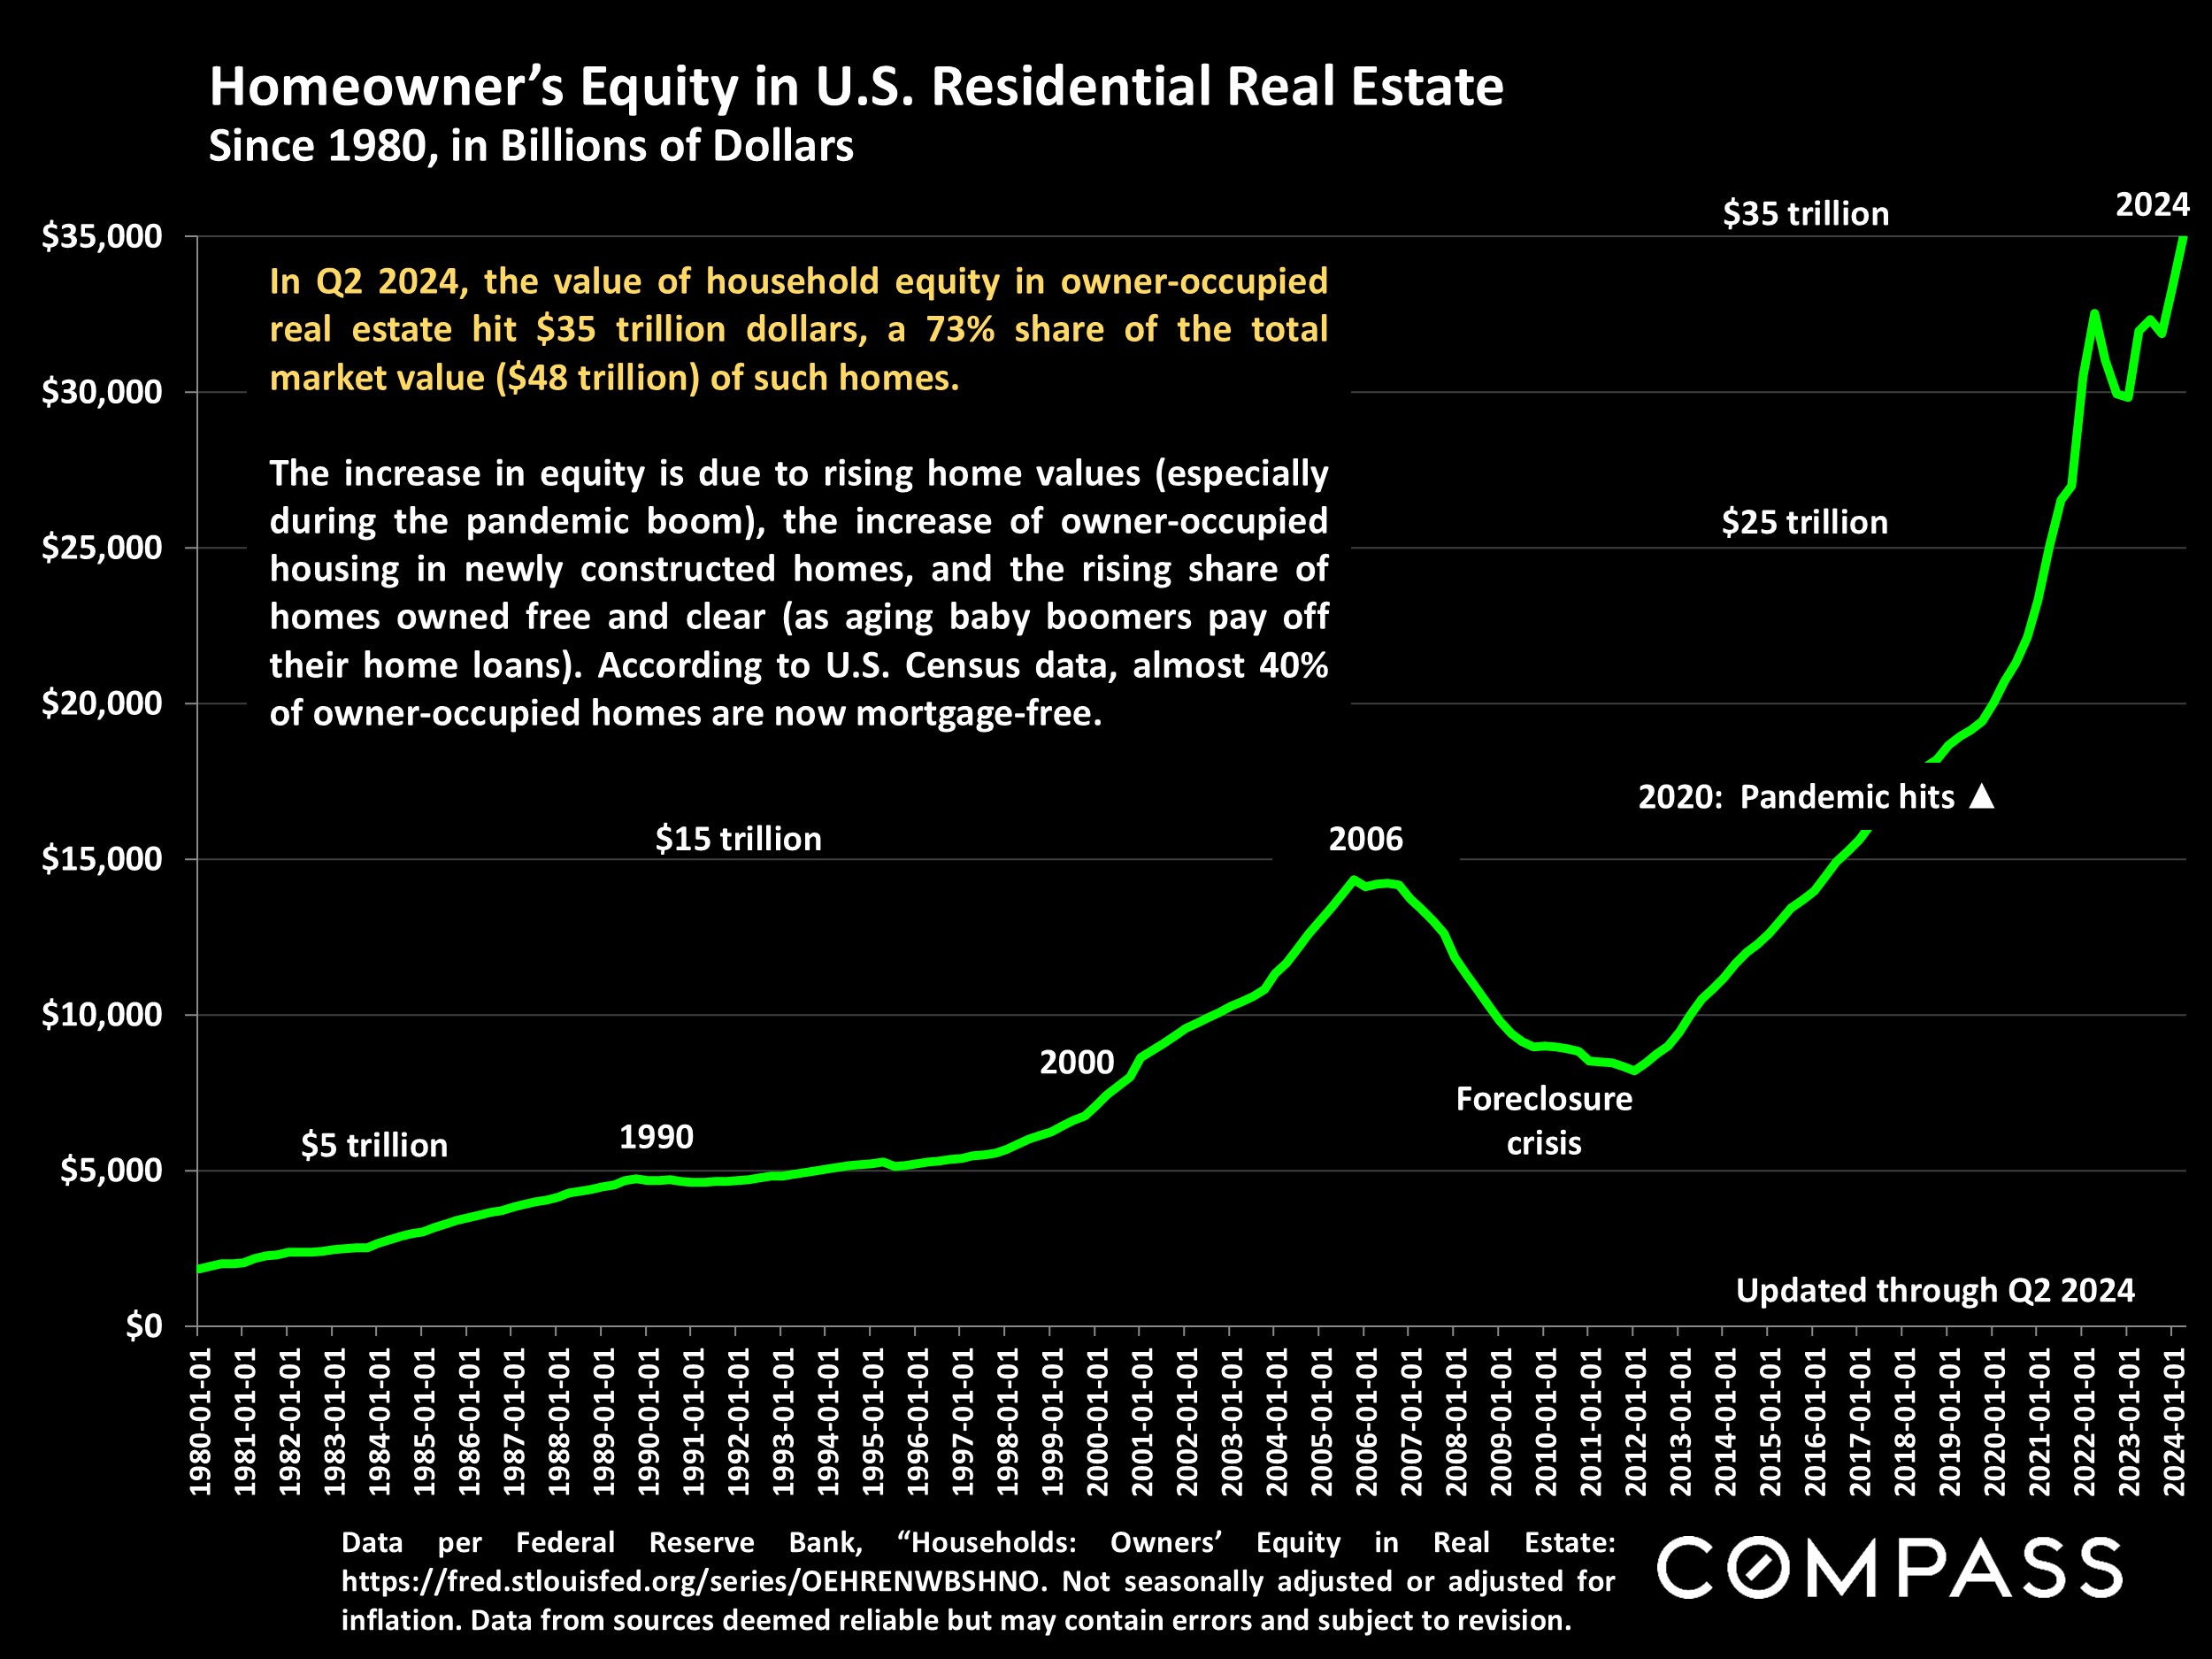
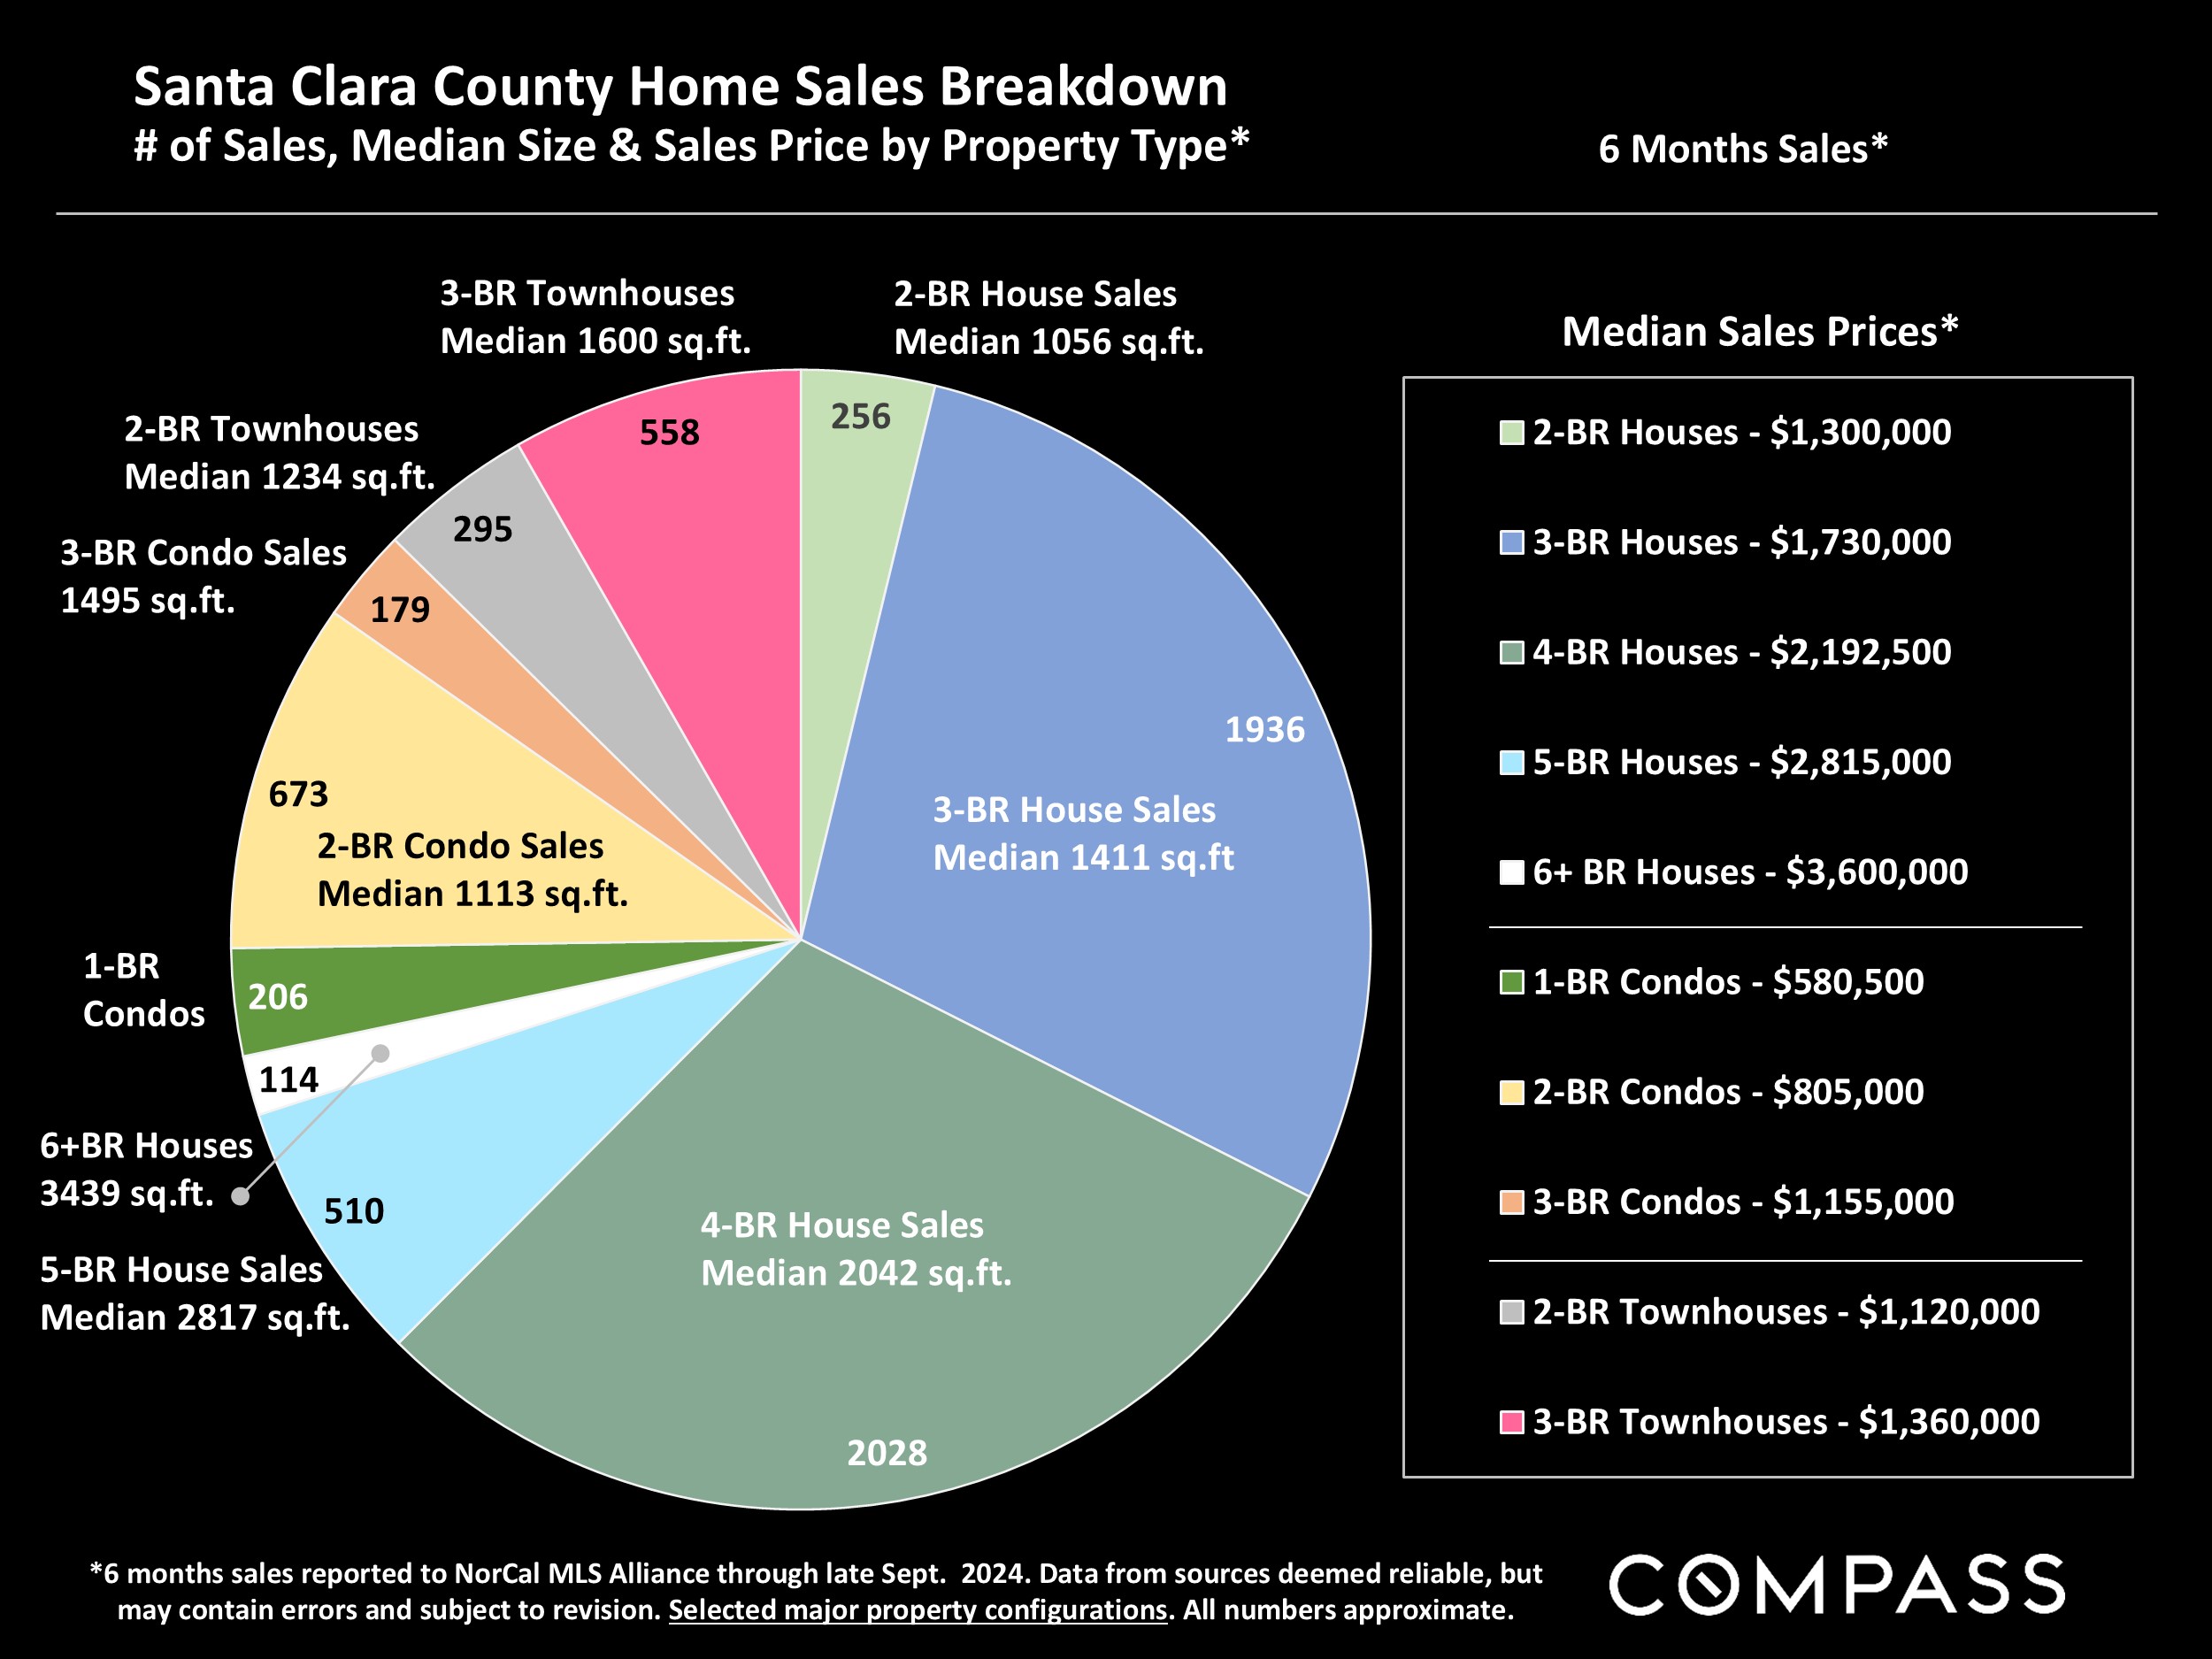
Median Sales Price is that price at which half the properties sold for more and half for less. It may be affected by seasonality, “unusual” events, or changes in inventory and buying trends, as well as by changes in fair market value. The median sales price for an area will often conceal an enormous variety of sales prices in the underlying individual sales.
Dollar per Square Foot is based upon the home’s interior living space and does not include garages, unfinished attics and basements, rooms built without permit, patios, decks or yards (though all those can add value to a home). These figures are usually derived from appraisals or tax records, but are sometimes unreliable (especially for older homes) or unreported altogether. The calculation can only be made on those home sales that reported square footage.
Photo use under the Creative Commons License: https://creativecommons.org/licenses/by-sa/2.0/
Compass is a real estate broker licensed by the State of California, DRE 01527235. Equal Housing Opportunity. This report has been prepared solely for information purposes. The information herein is based on or derived from information generally available to the public and/or from sources believed to be reliable. No representation or warranty can be given with respect to the accuracy or completeness of the information. Compass disclaims any and all liability relating to this report, including without limitation any express or implied representations or warranties for statements contained in, and omissions from, the report. Nothing contained herein is intended to be or should be read as any regulatory, legal, tax, accounting or other advice and Compass does not provide such advice. All opinions are subject to change without notice. Compass makes no representation regarding the accuracy of any statements regarding any references to the laws, statutes or regulations of any state are those of the author(s). Past performance is no guarantee of future results.